 Written by
Whether you’re a first-time homebuyer or a grizzled veteran of the home-buying experience, you want to make sure you are taking out a mortgage you can afford. Homes can be good investments and the best home purchasers are those who taken on mortgages they can afford while buying an undervalued home. If you’re not a real estate expert, trying to figure out the true value of a home can be difficult. Below we analyzed data to find the most undervalued cities in the U.S in 2018.
We looked at data for 200 cities across nine metrics. Specifically, we created a model using data on unemployment rates, price per square foot, high school graduation rates, percent of residents with a college degree, crime rate, entertainment establishment density, average days with precipitation, average number of days with bad weather and walk score. Check out our data and methodology below to see where we got our data and how we put it together to create our final rankings.
This is our third annual study on the most undervalued cities in America. Check out the 2017 version here.
Key Findings
- Many cities still offer a great bargain – In total seven cities from last year’s top 10 claimed spots in this year’s top 10. Of the three cities which didn’t appear again, two (Overland Park, Kansas and Fort Collins, Colorado) fell into the top 15. We were missing data for the third city – Augusta, Georgia – so it was not included in this year’s study.
- California is overrated – According to our model, the quality of life in California cities does not match the price residents pay to live there. For example, our model estimates that San Francisco is one of the best cities to live in with a projected value of $691 per square foot. However the actual value per square foot there is nearly $972 per square foot. While our model ranks California cities well in terms of quality of life the ongoing housing crisis forces the housing costs up.
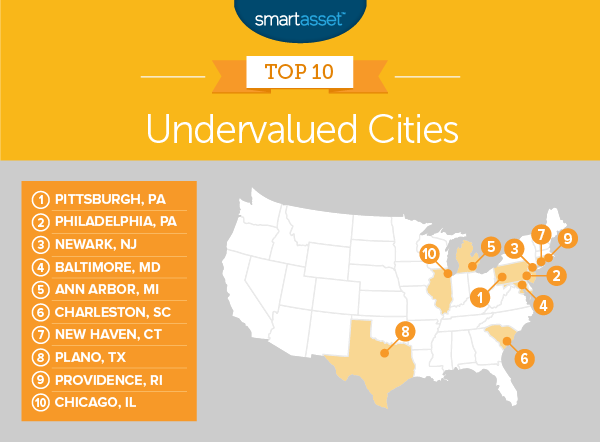
1. Pittsburgh, Pennsylvania
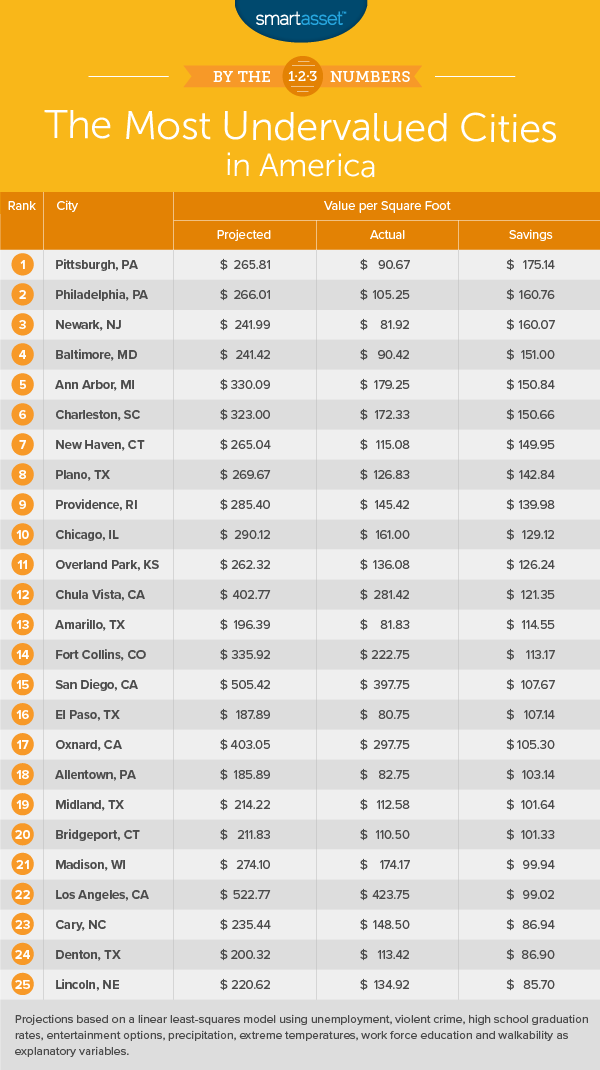
Pittsburgh tops the list as the most undervalued city in the country, according to our analysis. According to Zillow data, the average home in Pittsburgh is worth nearly $91 per square foot. However, our model suggests that Pittsburgh homes should be worth $266 per square foot.
One reason Pittsburgh is valued so highly is its educated population. This city has the 50th-highest high school graduation rate and the 35th-highest percentage of residents with a bachelor’s degree out of the 200 cities in the study. Overall our model suggests that living in Pittsburgh yields an estimated $175 per square foot in surplus value.
2. Philadelphia, Pennsylvania
Philadelphia is another undervalued Pennsylvania city. Our model loves walkable cities and there are few cities in America more walkable than Philadelphia. It scores a 79 for walkability, sixth-most in the study.
Philly is also a fun place to live. Our data shows that nearly 14% of establishments in Philadelphia are of the entertainment or dining variety, which is a top 10 rate. In total we estimate that Philadelphia is undervalued by nearly $161 per square foot.
3. Newark, New Jersey
Newark takes third. Zillow estimates the average home in Newark has a price per square foot of $82. However our model suggests that based on quality of life factors, living in Newark is equivalent to living in a city worth $242 per square foot. The biggest factor in favor of Newark’s livability is its walk score. Only four cities in our data set are more walkable than Newark. This city also scores in the top half for concentration of entertainment and dining establishments and days of precipitation.
One area where Newark could improve is by doing a better job of educating its residents. Only 14% of residents here have a bachelor’s degree a below average score.
4. Baltimore, Maryland
Baltimore, Maryland is another city which has been traditionally undervalued. Last year we ranked Baltimore in fifth and this year, it’s climbed a spot. According to Zillow data, the average home in Baltimore costs $90.42 per square foot but our model estimates homes should cost $241 per square foot, yielding a surplus value of $151.
Our model values Baltimore for its walkability and high concentration of dining and entertainment establishments. In both of those metrics, Baltimore ranks in the top 20.
5. Ann Arbor, Michigan
Ann Arbor, Michigan is a newcomer to this top 10. Last year, Ann Arbor finished as the 17th-most undervalued city in America. As a college town, it is no surprise that Ann Arbor has a large concentration of educated workers. Overall Ann Arbor has the highest concentration of residents with bachelor’s degrees.
The city also ranks in the top half for seven out of the nine metrics. In total, we estimate that living in Ann Arbor yields a savings of $151 per square foot.
6. Charleston, South Carolina
Last year’s No. 1 city is now valued more accurately, according to our data. Charleston is known as a place where you can get great food, and the high concentration of dining option is one reason our model values Charleston. Overall Charleston ranks 39th for concentration of dining and entertainment establishments.
Charleston also has a top 50 rate for low violent crime and ranks in the top 25 for lack of extreme weather days. Combine those high marks with one of the most educated workforces in our data set and it may be no surprise that Charleston is an undervalued city.
7. New Haven, Connecticut
New Haven is another city which makes a move up from outside the top 10 last year to inside the top 10 this year. This city improved its projected value from $227 per square foot last year to $265 per square foot this year. At the same time the actual cost per square foot, according to Zillow, stayed almost the same. That means the estimated savings from buying a home in New Haven jumped from $111 to $150.
Plus, if you are the sort of person who likes dining and entertainment establishments and walkability, New Haven is a good place for you. This city ranks in the top 10 for both of those metrics.
8. Plano, Texas
Plano dropped two spots from last year’s analysis. The good news is that Plano still offers a high amount of projected value over the average cost per square foot. According to Zillow data, the average cost per square foot of a home in Plano is $127 but according to our model, the cost per square foot should be $270.
This city is a good place for families with young children. It has a top 10 high school graduation rate and one of the lowest violent crime rates in our top 10. Additionally Plano has a top 20 score in percent of residents with a bachelor’s degree.
9. Providence, Rhode Island
Providence moved up one spot since we last ran this analysis. Overall Zillow data shows that the average cost per square foot in Providence is $145, while our model estimates it should be $285. This city ranks well thanks to the low amount of precipitation it gets and its walkability.
Providence could improve its score by lowering its unemployment rate and violent crime rate. In both of those metrics, Providence ranks below-average.
10. Chicago, Illinois
Chicago occupies the final spot in this top 10. As far as large cities go Chicago is fairly affordable costing only $161 per square foot. Given its high walkability, high concentration of dining and entertainment establishments and high percentage of residents with a bachelor’s degree, our model estimates that living in Chicago is worth $290 per square foot. That makes it the third-most valuable city in our top 10.
Living in Chicago and paying for the average home should yield a savings of $129 per square foot.
Data and Methodology
In order to find the most undervalued cities in America, we created a model to project home values based on quality of life metrics. To construct this model we collected data on nine metrics for 200 of the largest cities in the country. Specifically we collected data on the following metrics:
- Home value per square foot. Data is from Zillow and is for 2017.
- Violent crime rate per 100,000 residents. Data comes from the FBI’s Uniform Crime Reporting tool and is for 2016.
- High school graduation rate. Data comes from the U.S. Department of Education EdFacts and is for the 2015 – 2016 school year.
- Number of extreme temperature days. This is the average number of bad weather days a city has in a year. To measure this, we found the average number of days where the temperature exceeds 90 degrees or is under 40 degrees. Data is a 30-year average from 1981 – 2000. Data comes from the National Oceanic and Atmospheric Administration.
- Average number of precipitation days per year. This is the average number of days per year with at least 0.1 inches of precipitation. Data comes from the National Oceanic and Atmospheric Administration and is the 30-year average from 1981-2000.
- Walkability. This is a measure of how walkable a city is. Data comes from walkscore.com
- Percent of population with a bachelor’s degree or higher. Data comes from the U.S. Census Bureau’s 2016 1-Year American Community Survey.
- Unemployment rate. Data comes from the Bureau of Labor Statistics local area unemployment statistics. It is the average of the unemployment rates for April 2018, March 2018 and February 2018.
- Concentration of dining and entertainment establishments. This is the number of dining and entertainment establishments as a percent of all establishments in a city. Data comes from the Census Bureau’s 2016 Zip Codes Business Pattern Survey.
To model home value per square foot, we ran a linear least squares regression with home value per square foot as the dependent variable using the eight quality of life metrics as explanatory variables. Below is the formula to measure estimated dollars per square foot:
Home value per square foot = 41.71 – (0.05 * violent crime rate) + (1.57 * average high school graduation rate) + (5.56 * dining and entertainment establishments per 100,000 residents) – (2.47 * average number of days of significant precipitation per year) – (1.45 * number of days with extreme high or low temperatures per year) + (3.03 * percentage of the population with a bachelor’s degree or higher) + (5.26 * walk score) – (21.07 * unemployment rate).
The above formula may seem complicated but it is actually quite easy to read. For example, we see that in our formula walk score is multiplied by 5.26 (this figure is known as the coefficient). This means that if a city’s walk score improves by 1, assuming all other metrics remain constant, the projected home value per square foot would increase by $5.26 per square foot.
We can see how overvalued or undervalued a city is by plugging our data back into our formula. By plugging the collected data back into our model we get a projection for home value per square foot which we can compare to the Zillow data. In order to create our final rankings, we subtracted the estimated value per square foot by the actual Zillow value per square foot. The city with the largest positive difference ranked first while the cities with the largest negative difference ranked last.
In order to create our model we only included quality of life metrics. We left out other potentially explanatory variables like population change and new home change. Because of this, these figures are not meant as a prediction.
Tips for Buying an Affordable Home
- It might make more sense to rent – If you are just moving to a city, ask yourself how long you are going to live there. If your answer is just a few years, it may make more sense to rent rather than buy. Even if your home increases in value during the time you own it you will still be out the closing costs, not to mention the risk that you won’t be able to sell your house when you are looking to move.
- Extras can hurt – Your mortgage will make up the largest chunk of your housing cost budget, but first-time homeowners may not know that when you own a home you pay for more than just a mortgage. Property taxes and homeowners insurance are two costs that can be overlooked. The property taxes in New Jersey and Illinois, for example, are very high. Conversely residents in California and Hawaii face relatively low property taxes.
- Talk to an expert – It never hurts to get a second opinion. If you are thinking about buying a home, it may make sense to talk to a financial advisor to see how owning a home fits in with the rest of your investments. You may find that it is better to rent and invest the money you were saving for a down payment. If you are not sure where to find a financial advisor, try SmartAsset’s financial advisor matching tool. It will match you with a local advisor who has an expertise in your needed areas.
Questions about our study? Contact press@smartasset.com.
Photo credit: ©iStock.com/Ultima_Gaina