 Written by
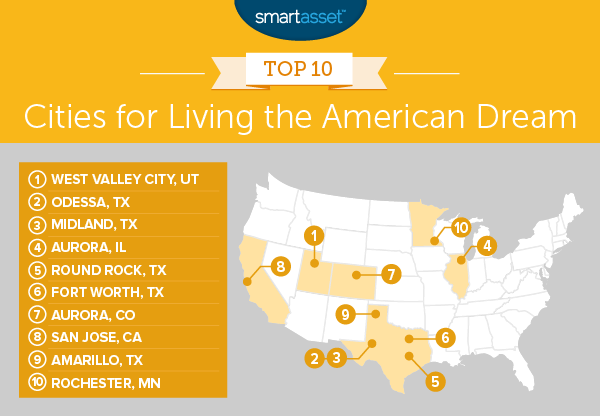
It is difficult to come up with any one definition for the American Dream that every American will agree on. But certainly for many people, it includes homeownership, economic opportunity and diverse communities. For these people, they need to live in a city where homes, and mortgages, are affordable and where it’s possible to climb the economic ladder. Below we look at this special combination of traits to rank the best places for living the American Dream.
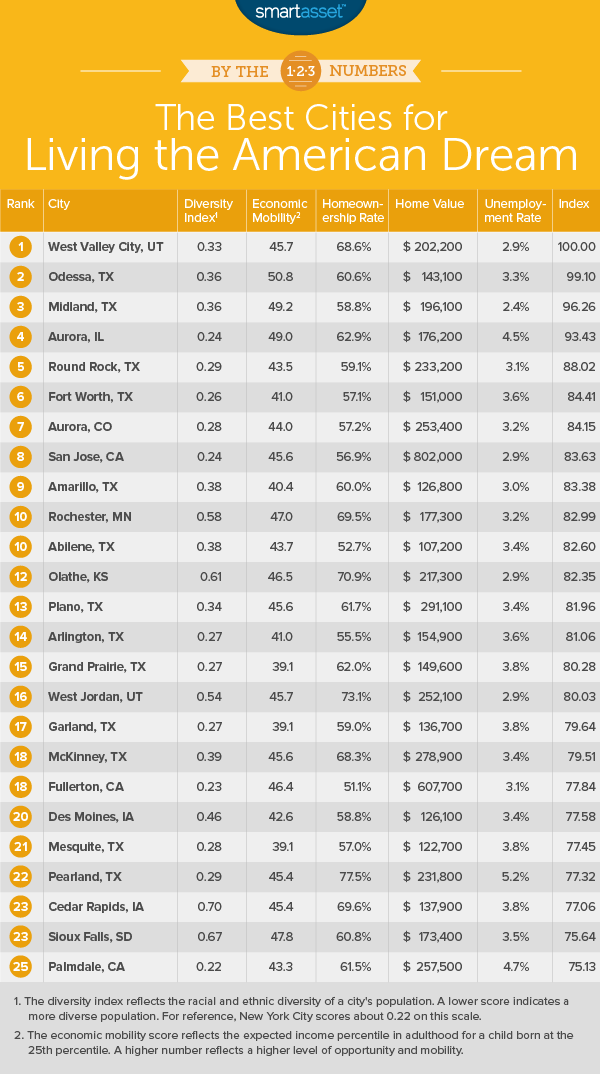
In order to rank the best places for living the American Dream, we looked at data on five metrics. Specifically we looked at the homeownership rate, diversity rate, upward mobility rate, median home value and unemployment rate.
Key Findings
- The dream endures – Six of last year’s top 10 found themselves in the top 10 again this year. Those repeat cities are: West Valley City, Utah; Midland, Texas; Aurora Illinois; Round Rock, Texas; Aurora, Colorado and Rochester, Minnesota.
- Texas is where the dream lives – Half of the cities in our top 10 are located in Texas. Cities in Texas tend to have affordable homes and plenty of good jobs, driving down the unemployment rate and improving upward economic mobility.
This is the 2018 edition of this study. Check out our 2017 version here.
1. West Valley City, UT
Once again West Valley City, Utah takes the top spot. West Valley City has an unemployment rate of only 2.9%. Only 11 other cities can boast of having a lower unemployment rate. Of course having plenty of jobs available is one thing, but a main tenet of the American Dream is upward mobility. West Valley City ranks 22nd in upward mobility, putting it in the top 10% of all cities.
One metric where West Valley City fell short is its diversity score. It ranks 94th in that score.
2. Odessa, TX
Last year, Odessa ranked 24th but jumped an impressive 22 spots to secure the second spot this year. One reason for the improvement is the large drop in the unemployment rate. Last year, Odessa had a 5.8% unemployment rate but this year, the unemployment rate is only 3.3%.
Odessa also continues to be the most upwardly mobile city in the study.
3. Midland, TX
Midland, Texas is another upwardly mobile city with a low unemployment rate. In both our mobility and unemployment rankings, Midland comes in third.
While those economic indicators are good for the American Dream in Midland, the city could improve on its homeownership rate, which is currently only 59%.
4. Aurora, IL
Aurora, Illinois is the most diverse city in our top 10. It has a diversity score of 0.24, putting it in 22nd place in the study for that metric. Aurora also has an upward mobility score of 49, the fifth-highest in our study.
If Aurora wants to jump into the top three spots, it will need to improve its unemployment rate. Our data shows that Aurora has an unemployment rate of 4.5%, putting it in the bottom half of our rankings for that metric.
5. Round Rock, TX
Texas’ strong showing continues with Round Rock in fifth. This city scores in the top third of cities in four out of five metrics. In particular the economic conditions in this city are good for anyone trying to live the American Dream.
This city has a fairly high upward mobility rate and a low unemployment rate. Overall data from the Bureau of Labor Statistics shows that only 3.1% of residents in Round Rock are unemployed.
6. Fort Worth, TX
Fort Worth is one of the most affordable cities in our top 10. Many residents in this city should be able to afford a home. The median home here is worth only $151,000, which is well below the national average. However, the homeownership rate is slightly low for our top 10, suggesting it takes more than affordable homes to encourage people to buy vs. rent.
Fort Worth is let down by its mobility score, however. This city ranks 132nd out of 250 cities in upward mobility for its residents.
7. Aurora, CO
Another city named Aurora, this time the one in Colorado, finds itself in the top 10. Aurora, Colorado owes its place in this top 10 to the availability of work. This city has an unemployment rate of only 3.2%.
But many cities have low unemployment rates and do not end up in our top 10. Aurora is also fairly diverse with a good amount of upward mobility, which gives it the edge over other cities. Aurora ranks in the top 25% for both diversity score and upward mobility.
8. San Jose, CA
San Jose scores very well in all metrics bar two – both related to housing. Unfortunately the majority of residents in San Jose are largely unable to afford the median home. According to our data, the median home in San Jose is worth over $800,000 by far the most in our top 10 and one of the highest in the study.
Balancing out those unaffordable homes however are a low unemployment rate, high amounts of diversity, a lot of economic upward mobility and rising incomes.
9. Amarillo, TX
Amarillo jumped up nine spots from last year’s study to take ninth this year. Like other Texas cities, Amarillo residents enjoy a plethora of available jobs. The city has an overall unemployment rate of only 3%.
It is also one of the friendliest home-buying markets in the country, judging by the homeownership rate. Over 60% of households in Amarillo own homes. For most residents, homeownership should not be an unattainable goal, either. The median home in Amarillo is worth less than $127,000.
10. Rochester, MN
Our list ends in Rochester, Minnesota, one of the best cities for working women. Rochester ranks well thanks to high upward mobility and high homeownership rates. In those metrics, Rochester ranks 11th and 22nd, respectively.
In fact, if it weren’t for the lack of diversity (Rochester ranks 235 out of 257 in diversity), this city would rank higher.
Data and Methodology
In order to rank the best cities for living the American Dream, SmartAsset looked at the largest 257 cities which we had data for. Specifically, we compared the cities across the following five metrics:
- Diversity score. To create this statistic, we looked at the population percentage of different racial and ethnic groups in each city. A lower number represents more diversity. Data comes from the U.S. Census Bureau’s 2016 1-year American Community Survey.
- Economic mobility. This metric looks at generational change in economic position for families. A higher number shows greater mobility. Data comes from The Equality of Opportunity Project.
- Homeownership rate. This is the percent of households who own their home. Data comes from the Census Bureau’s 2016 1-year American Community Survey.
- Home value. This is the median home value in every city. For this study, a lower home value is considered better as we use it as a measure of affordability. Data comes from the Census Bureau’s 1-year American Community Survey.
- Unemployment rate. This is the unemployment rate by county. Data comes from the Bureau of Labor Statistics and is for January 2018.
To create our overall index, we ranked each city in each metric. We then found the average ranking for each city. Using this average ranking, we created our final score. We based our final score on that index. The city with the best average ranking received a score of 100 and the city with the worst average ranking received a score of 0.
Tips for Buying a Home You Can Afford
- Start saving early – You are probably aware of how expensive buying a home can be. However this does not just mean the mortgage payments are expensive. In order to buy a home, you need to have saved for a down payment. In order to have a down payment ready, you need to be saving years in advance. With that in mind, if you have any plans on being a homeowner, it’s a good idea to start saving today for your down payment so that when you find your dream home on the market you are ready to snap it up.
- Factors extras into your budget – Depending on where you are buying your home, property taxes can affect what kind of homes you can afford. For example, the average annual property taxes in New Jersey are $5,503. That is equivalent to paying an extra $458 per month. If you were already nearly unable to afford your home before property taxes, it is likely property taxes will push you over the affordability edge.
- Talk to an expert – Buying a home is a big decision and there is a lot of information for new homebuyers to digest. Before you make any decisions, it’s a good idea to talk to a financial expert about how buying a home will impact your overall financial health. SmartAsset’s financial advisor matching tool can help. Simply answer a few questions and get matched with up to three advisors in your area.
Questions about our study? Contact us at press@smartasset.com.
Photo credit: ©iStock.com/mediaphotos