 Written by
Almost half of renters (46%) spend more than 30% of their income on rent, according to Census Bureau data. This means they are classified as housing cost-burdened based on guidelines from the Department of Housing and Urban Affairs. Rents across the nation continue to rise, especially in the biggest cities in the country. Below we compare rents and incomes to find the cities with the largest rent increases.
Looking to switch from renting to buying? Check out current mortgage rates.
In order to find the cities with the largest rent increases, SmartAsset gathered data on four factors. We considered 2013 median household incomes, 2016 median household incomes, 2013 average rent and 2016 average rent. To see where we got our data and how we put it together check out our data and methodology section below.
Key Findings
- Incomes matter – Rental prices in some of the most expensive markets in the country often make headlines. Take San Francisco, our data suggests renting the average place here costs over $3,800 per month, an enormous sum by most standards. But the average SF household earned over $103,000 in 2016, a figure which grew $26,000 from 2013. That growth has meant the rent is slightly less burdensome for San Francisco households than it might be. But in cities where incomes are not growing as fast, residents may be unable to keep up with rent. For example, in New Orleans, the top ranked city, average rent costs grew 36% while average household income only grew 5.6%.
- Sky-rocketing rent in the Golden State – Four of the top 16 cities with the largest rent increases are in California. The highest ranking California city is Los Angeles, followed by Oakland and Long Beach.
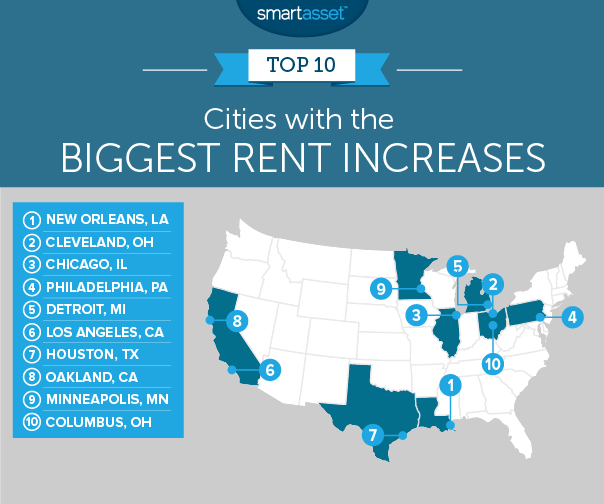
1. New Orleans, Louisiana
No city in our study has seen the rent affordability deteriorate quite as much as New Orleans. According to our data, from 2013 to 2016 median household incomes rose about $2,000. Over the same period average monthly rents jumped about $400. That means more income than ever is going to rent.
In fact, we estimate that around 47% of the average New Orleans household’s income would go to rent on the average home.
2. Cleveland, Ohio
According to our data, the average Cleveland household earns $27,551 per year. That is the lowest in our top 10. When you are not earning much any fluctuation in rent prices can do serious damage to your budget.
Despite median rents only increasing by about $250 from 2013 to 2016, average Cleveland renters are now looking at paying about 42.6% of their income on rent. An increase of 9.2 percentage points from 2013.
3. Chicago, Illinois
Chicago households have done pretty well for themselves economically. From 2013 to 2016 average household incomes rose by an average of $1,500 per year. However, at the same time rent prices were sky-rocketing and incomes did not keep up.
Our data suggests that renters here are paying $6,000 more per year in 2016 than they were in 2013, on average. That means 100% of the increase in incomes for households would be going toward making rent each month. In total our data suggests the average household would need to spend 44.3% of their income to paying rent, an increase of 6.7% from 2013.
4. Philadelphia, Pennsylvania
The City of Brotherly Love takes fourth. On average, Philadelphia households went from spending 43% of their incomes on rent in 2013 to spending just under 50%.
The main culprit in Philadelphia is rising rent costs. Our data suggest monthly fair market rents jumped 28% from 2013 to 2016. At the same time average household incomes only grew 13%.
5. Detroit, Michigan
Few places are better for finding a good deal on a home than Detroit, Michigan. However due to relatively low incomes, renters in the Motor City may be struggling.
Our data shows that in 2013, the average household could expect to pay about 37% of income on rent. In 2016 that number rose by 5.5% to 42.5%.
6. Los Angeles, California
The nation’s second-largest city is becoming less affordable for renters. In fact for the majority of households renting in Los Angeles is expensive. The average rental in Los Angeles, according to our data, costs over $2,500 per month. That is the second-highest in the top 10.
Overall in 2013 the average L.A. household could expect to dedicate 51.6% of income to paying the price of fair market rent. Four years later that number jumped to 56.8%.
7. Houston, Texas
Although famous for combining a big city atmosphere with smaller city prices, housing costs in Houston have begun to rise. Our data shows that average rent costs rose by over $260 from 2013 to 2016.
At the same time the average Houston household only has an extra $200 in their monthly budgets in 2016 compared to 2013. That means their entire raise (and some more) goes to rent.
8. Oakland, California
Median incomes in Oakland grew at breakneck speed from 2013 to 2016. Unfortunately average rents grew even faster. According to our data, renting the average home in Oakland costs $800 more per month in 2016 than it did in 2013.
That increased rent does huge damage to Oakland budgets, even accounting for the $14,000 in increased annual incomes average Oakland households now receive.
9. Minneapolis, Minnesota
Minneapolis residents started 2013 in a relatively comfortable place. According to our data, the average household in 2013 would have been just over the housing cost-burdened threshold set by the Department of Housing and Urban Development, paying 30.7% of their income on rent.
By 2016 that number has crept into an area which may not be sustainable for the long term. According to our data, if the average Minneapolis household wanted to rent the average home in 2016, they would need to portion over 35% of their budget to rent. That’s an increase of 4.8% from 2013.
10. Columbus, Ohio
Despite its inclusion in this list, renting in Columbus is still affordable – at least for now. From 2013 to 2016, the average Columbus household went from spending 21% of their income on rent to 25.3%.
Both of those numbers are under the U.S. Department of Housing and Urban Development recommended amount, but if the numbers continue to rise, Columbus residents may find themselves housing cost-burdened.

Data and Methodology
In order to find the cities with the largest rent increases, we looked at data for the 50 largest cities in the country. Specifically, we looked at data on the following two metrics:
- 2013 rent as a percent of income. This is average fair market rent as a percent of income for the median household. Data comes from the Census Bureau’s 2013 1-year American Community Survey and RentJungle.com
- 2016 rent as a percent of income. This is average fair market rent as a percent of income for the median household. Data comes from the Census Bureau’s 2016 1-year American Community Survey and RentJungle.com
We found the difference between rent as a percent of income in 2016 and 2013, and then ranked the cities from largest difference to smallest.
Tips for Saving on Rent
Rent can get expensive. If you want to hit your financial goals, like saving for retirement, you will want to save some money. Here are some tips for save on renting.
- Finding a roommate is a great way to save. In fact you can save thousands of dollars per month by moving in with a roommate. Sites like Craigslist, Padmapper and Roomi are great places to begin your roommate search.
- Another option may be to negotiate a longer lease. By switching from the standard 12-month lease to an 18 or 24-month lease, you avoid having to deal with annual rent increases. You may even be able to ask your landlord for a small cut in his asking price based on the fact that you’re agreeing to live there for a longer period.
Data analysis for this article was done by Nick Wallace.
Questions about our study? Contact us at press@smartasset.com
Photo credit: ©iStock.com/AntonioGuillem