 Written by
The United States is a global leader in many regards, but when it comes to education it seems there is room to improve. According to the OECD, U.S. schools rank 28th in the world based on student reading and writing performance at age 15. That places us in the same league as European countries like Italy and Norway. On the other hand, we still lag behind Canada and several Asian countries, including Japan and South Korea.
This is SmartAsset’s second annual study of the states with the best schools. Read the 2015 version here.
What is true for the United States as a whole, however, is not necessarily true in every part of the country. Since public school districts are funded and administered at the state and local level, there are large disparities between states when it comes to school performance. (According to the U.S. Census Bureau, formula assistance funding is the largest source of revenue for public elementary and secondary schools, followed closely by property taxes.)
Take for example one measure of educational achievement: high school graduation. While the national high school graduation rate is about 80%, a handful of states have a graduation rate of 90%. In one state, New Mexico, the graduation rate is less than 70%.
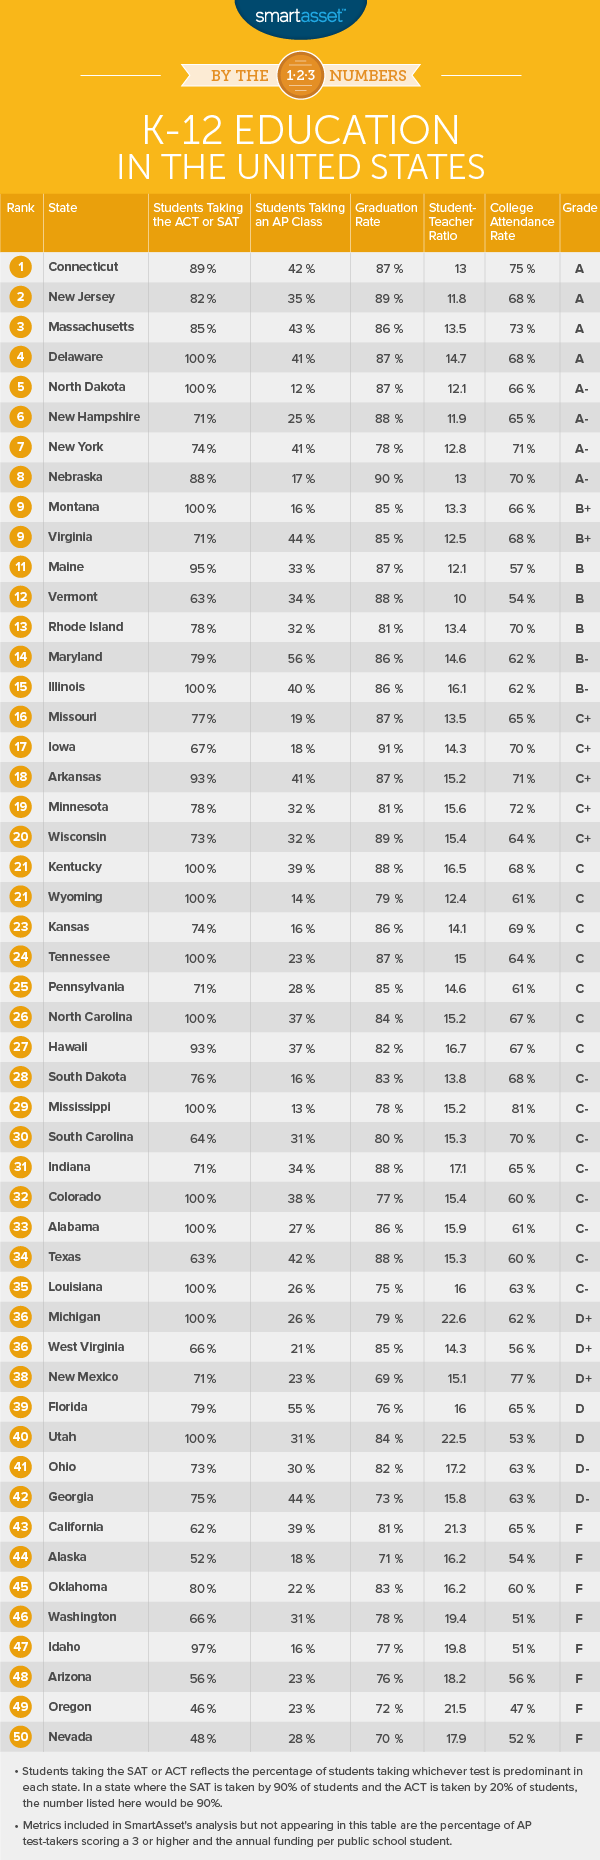
To determine which states have the best schools, SmartAsset looked at seven metrics of school quality and performance in all 50 states. Along with the overall graduation rate in each state, we looked at measures such as the percentage of students taking a college entrance exam, the percentage of students taking an advanced placement test and the student-teacher ratio. (Read more about our methodology below.)
Try SmartAsset’s super-smart student loan calculator.
Key Findings
- Top three unchanged. Connecticut, New Jersey and Massachusetts ranked first, second and third in 2015. They held those same spots in this year’s ranking.
- The west continues to underachieve. Seven of the eight states that received an F in SmartAsset’s analysis are out west. Places like Nevada, Arizona and Oregon have student-teacher ratios that are higher than average and graduation rates that are lower than average.
- States with more teachers have higher graduation rates. There is a significant negative correlation (-44%) between the student-teacher ratio in states and the graduation rate. That is, states with a lower student-teacher ratio tend to have a higher graduation rate.
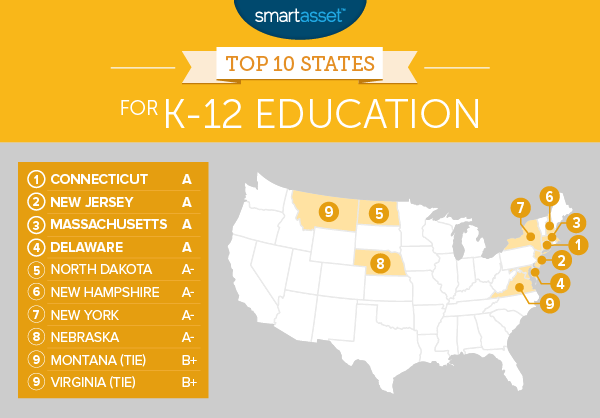
1. Connecticut
For the second year in a row, Connecticut ranks first in the U.S. for its K-12 education system. SmartAsset’s analysis found that 75% of Connecticut high school graduates go on to attend college within 12 months of graduation, the third-highest college attendance rate in the U.S.
Many of those who do attend college will have a leg up upon arriving. The state has the seventh-highest rate of participation in the advanced placement program, with 42% of 11th and 12th grader taking an AP class in 2015. Of those, more than 70% scored at least a 3 on their exam, the second-best percentage in the U.S. (A 3 is generally the minimum score required to be eligible for college credit from an AP class.)
Moving to Connecticut? Find out what your taxes will be.
2. New Jersey
As of fall 2013 there were 1.3 million students in New Jersey’s k-12 public schools, making it the 11th largest school system in the U.S. At the same time, it had the ninth-largest k-12 instructional workforce, with about 123,000 instructional staff members at public schools. That means there are less than 12 students for every teacher in New Jersey, giving in the country’s second-best ratio (behind Vermont).
Likewise, its high school graduation rate is among the best in the country. 89% of New Jersey high school students graduating within four years.
3. Massachusetts
The Bay State is known for having some of the best colleges and universities in the world, but according to our analysis, it also does a good job of getting high school students prepared for those (and other) schools. Over 73% of Massachusetts high school graduates go on to college within 12 months of graduating. That’s the fourth-highest rate in the nation.
4. Delaware
Despite having property taxes that are lower than the national average, Delaware ranks fourth in the nation for its k-12 education. How? One key factor is its college admissions testing program. In 2011, Delaware became one of the first states in the U.S. to provide free college admissions testing during a school day to every public school student.
According to the College Board, 9,823 of Delaware’s 2015 high school graduates took the SAT at some point during their high school careers. That means the SAT testing rate was 100%, higher than any other state in the nation. (Several other states have ACT testing rates of 100%.)
5. North Dakota
The SAT was once the default for college entrance tests (the acronym stands for “Standard Admissions Test”) but today a greater number of students take the ACT (which used to stand for American College Testing). It has grown in prominence because of a number of states which have begun funding statewide ACT testing.
In 2009, North Dakota became the sixth state to offer the test for free to all of its students. Today, 100% of high school graduates in North Dakota take the ACT test. That means one less hurdle to clear on your own when applying for college.
Find out why Fargo, North Dakota, ranks as a top city for raising children.
6. New Hampshire
According to the Western Interstate Commission for Higher Education, New Hampshire has the nation’s sixth-highest high school graduation rate. More than 88% of public school students graduate from high school on time in the state.
Teachers can play a crucial role in making sure students do not slip through the cracks, which may help to explain New Hampshire’s high graduation rate. There are fewer than 12 students to every teacher in New Hampshire public schools, the third-best ratio in the U.S.
7. New York
For the second year in a row, New York ranks among the top 10 states for k-12 education. More than 150,000 students took an AP class in New York in 2015, which equals about 41% of all juniors and seniors in the state. That is the eighth-highest AP testing percentage in the U.S.
The state likewise has one of the best student-teacher ratios in the country. According to the National Education Association, there are about 13 students for every teacher in New York.
8. Nebraska
About 90% of high school students in the Cornhusker State graduate within four years. That is the second-highest high school graduation rate of any state in the country, just behind neighboring Iowa. Nebraska also ranks among the ten best states in the country for the percentage of students that go on to college. About 70% of Nebraska high school graduates attend college within 12 months of leaving high school.
9. Montana
All Montana high school juniors are required to take the ACT test. It serves double duty as an assessment test for the state and a college entrance exam for students. The state average score of 20.4 on the ACT ranks second among the 13 states that require the test. (State average scores are higher in states which do not require.)
10. Virginia
Along with having great k-12 schools, Virginia is one of the nation’s best states for higher education. It rates especially high for the percentage of eligible students who enroll in an AP class, at 44%. According to the College Board, students who complete an AP course are more likely to graduate from college on time.
Data & Methodology
SmartAsset simplified our methodology somewhat from last year, placing greater emphasis on graduation rates and college attendance.1 In particular, we considered the following seven metrics:
- Graduation rate. This is the 2013-2014 public high school 4-year graduation rate. Data comes from the National Center for Education Statistics.
- Student-teacher ratio. The number of students enrolled per teacher in public K-12 schools as of 2013. Data comes from the National Education Association’s 2015 Rankings & Estimates report.
- Funding per student. The public school revenue per student enrolled for the 2013 to 2014 school year. Data comes from the National Education Association’s 2015 Rankings & Estimates report.
- Percentage of students taking an advanced placement (AP) class. The number of students enrolled in an AP class in 2015 as a percentage of 11th and 12th grade enrollment. Data comes from the College Board.
- Percentage of students scoring a three or higher on AP exams in 2015. A three is generally the minimum score required to be eligible for college credit through an AP course. Data comes from the College Board.
- Percentage of students taking the ACT or SAT. Since most states favor one or the other of these tests, we used whichever test had a higher testing rate. For example, in Connecticut, 89% of students take the SAT and 32% take the ACT. Thus we treated the SAT as the state’s primary test.
- College attendance rate. The percentage of 2012 high school graduates who enrolled in a college or university within 12 months. College attendance data comes from the National Center for Education Statistics and high school graduation data comes from the Western Interstate Commission for Higher Education.
We ranked all 50 states according to these seven metrics. We then averaged those rankings, giving half weight to the two measures of AP testing and full weight to all other metrics. Grades were based on those average rankings. The top 15% of schools received an A (or A-), the next 15% received a B, the next 40% received a C, the next 15% received a D and the bottom 15% received an F.
Questions about our study? Contact us at blog@smartasset.com.
Photo credit:©iStock.com/Christopher Futcher
1. There were three metrics we considered in last year’s analysis that we excluded this year. Those were the percentage of students taking a secondary college entrance exam (whichever of the SAT or ACT is taken by fewer students in each state), and the average scores on the ACT and SAT. Considering a secondary exam penalized states like North Dakota, which requires all students to take the ACT. As a result, very few students take the SAT, as it is unnecessary. Likewise, considering average scores favors states where only top students take entrance exams.