 Written by
  In recent years, housing demand has increased by more than 10% in some cities while declining by almost 5% in others. And amid that disparity, it’s important to be strategic about where it would be best to take out a mortgage or put a house up for sale, since not all markets are performing equally well. With that in mind, SmartAsset compiled data to find where housing markets in the U.S. are rising more than others, so that you can make more informed decisions as a buyer or seller.
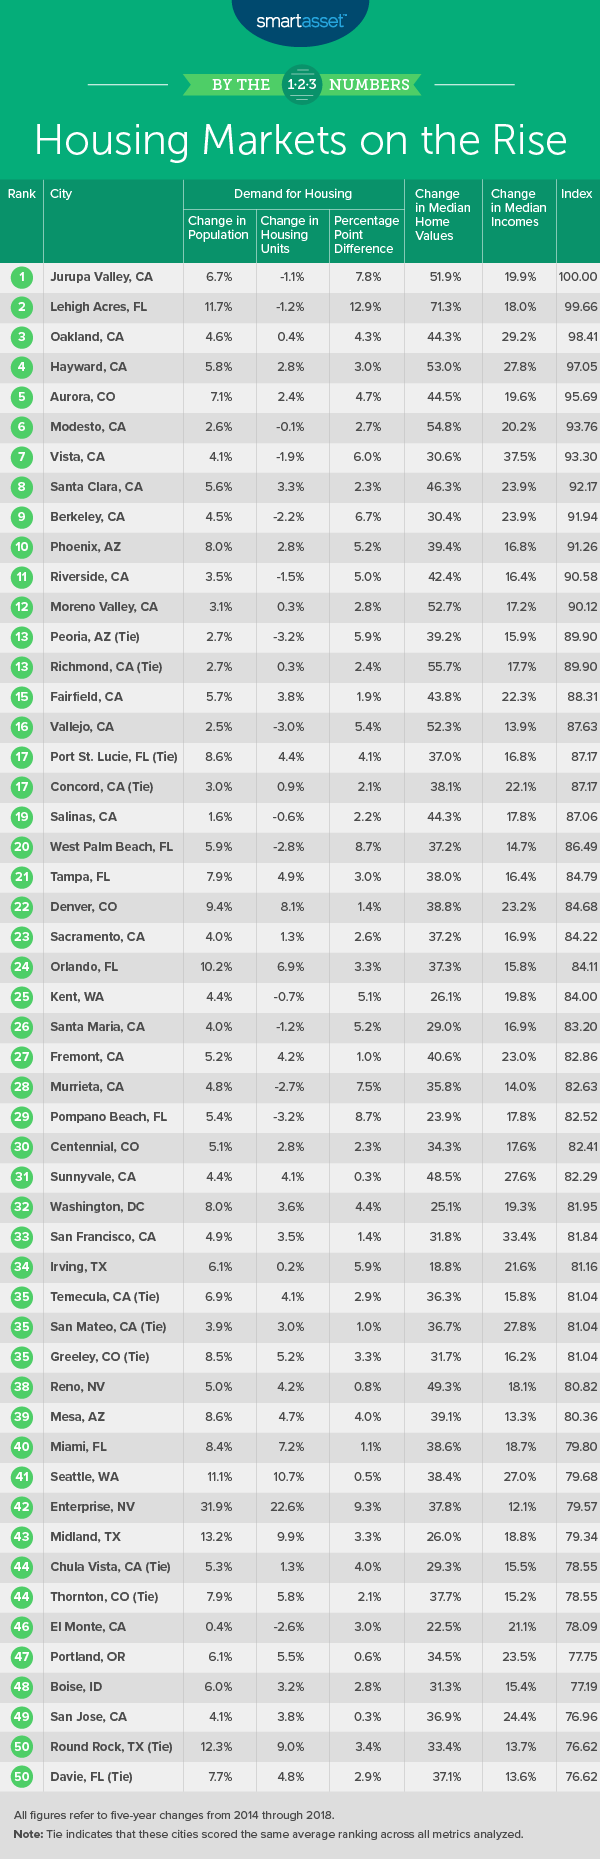
To find the top 10 rising housing markets across the country, we looked at data from 2014 and 2018 (the most recent year available) for the 317 U.S. cities with a population greater than 100,000 across the following three metrics: housing demand (i.e. percentage point difference between population growth and housing growth), four-year change in median home value and four-year change in median household income. For details on data sources and how we put all the information together to create our final rankings, check out the Data and Methodology section below.
This is SmartAsset’s fourth annual study of the top 10 rising housing markets. Check out the 2019 version here.
Key Findings
- California leads the top 10 again. Like in last year’s study, not only does a California city take the top spot, but the majority of cities in the top 10 are in the state as well. Seven of the top 10 cities in our study this year are in the Golden State, compared to six in our 2019 study, two in our 2018 study and just one in our 2017 study. From 2014 through 2018, median household income in these cities increased by more than 26% on average.
- Florida cities stand out amid dominance from mostly Western cities. The only non-Western state represented in our top 25 is Florida, which holds the following spots: Lehigh Acres at No.2, Port St. Lucie at No. 17, West Palm Beach at No. 20, Tampa at No. 21 and Orlando at No. 24.
- Housing markets are consistently rising in Oakland, Aurora and Vista. For the three latest versions of this study, Oakland, CA; Aurora, CO and Vista, CA have consistently ranked in the top 10. The four-year change in median home value for each city has increased over those years as well. From 2014 to 2018, the median home value increased by more than 30% in each of these cities.
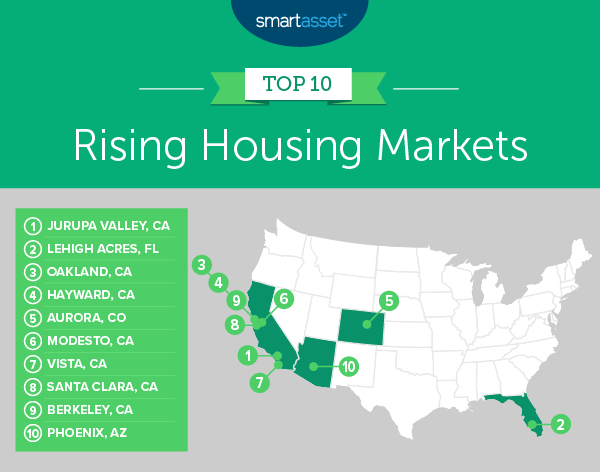
1. Jurupa Valley, CA
A Southern California city, Jurupa Valley ranks within the top 10% of the study for all three metrics we considered. It experienced an almost 8% increase in demand for housing from 2014 to 2018, ranking seventh overall for this metric. Its four-year change in median home value from 2014 to 2018 was about 51.9%, ranking fourth-highest in the top 10 and 10th out of 317 total cities. Finally, the median household income in Jurupa Valley increased by about 19.9% in the four-year period from 2014 to 2018, ranking 30th overall. Residents looking to move might be able to take advantage of Jurupa Valley’s booming housing market by selling their home.
2. Lehigh Acres, FL
The only Southern city in the top 10, Lehigh Acres, Florida comes in second overall and outperforms all 317 cities in the study for two of the three metrics: housing demand and home value growth. The population outgrew the number of housing units by almost 13% in the four-year period from 2014 to 2018, and home values increased by more than 71% during that time period as well. Lehigh Acres falls behind in terms of income growth, though it still ranks within the top 50. During the same four-year period, median household income increased by almost 18%.
3. Oakland, CA
Oakland, California makes it into the top three rising housing markets in the U.S. It ranks within the top 10% of the study for home value growth and within the top 1% of the study for income growth. Oakland residents spend a lot on housing, and that figure seems to be increasing. The median home value there rose more than 44% in the four-year period from 2014 to 2018.
4. Hayward, CA
The last of three California cities in our top five, Hayward has a growing housing market as indicated by its high home value growth as well as income growth in recent years. It ranks sixth out of all 317 cities we looked at for both of these metrics. In the four-year period from 2014 to 2018, the median home value increased by 53.0% and the median household income in Hayward increased by 27.8%.
5. Aurora, CO
Aurora, Colorado ranks within the top 35 of all 317 cities in our study for all three metrics we considered. Its demand for housing grew almost 5% from 2014 to 2018. In that four-year period, home values increased by approximately 44.5%, and income increased by about 19.6%. As you consider buying or selling in Aurora, it might be worth noting that it is a great city to buy a family home.
6. Modesto, CA
Modesto, California ranks within the top fourth of our study for all three metrics: housing demand, home value growth and income growth. From 2014 to 2018, the population in Modesto grew by about 2.7% more than the number of housing units, which indicates growing demand for housing. The city’s home value growth in the four-year period from 2014 to2018, at about 54.9%, is the second-largest increase in the top 10 and the fourth-largest in the study overall. Additionally, median household income increased by more than 20% in the same period.
7. Vista, CA
Vista, California ranks 12th of 317 for housing demand, with population growth between 2014 and 2018 outpacing housing unit growth by roughly 6%. The median home value in Vista during the same four-year period increased by almost 31%, and while that may pose an obstacle to affordability, median household income also grew. Between 2014 and 2018, incomes increased by about 37.5% on average, which is the largest growth in the study overall. What’s more, California’s overall property taxes fall below the national average.
8. Santa Clara, CA
Santa Clara, California has made a big bounce back from the Great Recession and its housing market has continued to rise over the past four years. It ranks in the top 20 of this study for both metrics of home value growth and income growth. The median home value in Santa Clara increased by about 46% from 2014 through 2018, the 20th-highest rate for this metric overall. Furthermore, the median household income increased by almost 24% during the same period.
9. Berkeley, CA
Berkeley is the seventh California city in our top 10. It ranks within the top third of the study for all three metrics we considered. In terms of demand for housing, Berkeley’s population growth from 2014 to 2018 outpaced its housing unit growth during the same time period by 6.7%, a top-10 rate. The median home value in the city increased by more than 30% in the four-year period from 2014 to 2018, and the median household income there increased by almost 24% in the same period. Homeowners and potential homebuyers in the area who might need more insight on how entering the housing market might affect their overall financial health may benefit from reaching out to an expert financial advisor in Berkeley.
10. Phoenix, AZ
Out of 317 total cities for which we considered data, Phoenix, Arizona ranks 20th for demand for housing, 37th for home value growth and 67th for income growth. From 2014 to 2018, the population grew about 5.2% more than the number of housing units, suggesting increased housing demand. Additionally, the median home value increased more than 39%, and the median household income increased by almost 17% in the same four-year period.
Data and Methodology
To find the top rising housing markets, we looked at data for the 317 U.S. cities with a population greater than 100,000 in 2018. We analyzed this information across the following three metrics:
- Housing demand. This is the percentage point difference between population growth and housing unit growth from 2014 to 2018.
- Home value growth. This is the percentage change in median home values from 2014 to 2018.
- Income growth. This is the percentage change in median household income from 2014 to 2018.
Data for all metrics comes from the Census Bureau’s 2014 and 2018 American Community Surveys.
First, we ranked each city in each metric. Then we found each city’s average ranking, giving each metric equal weight. Using this average ranking, we created our final score. The city with the highest average ranking received a score of 100. The city with the lowest average ranking received a score of 0.
Tips for Making and Managing Home Payments
- Make sure you’re ready. If you’re thinking about entering the housing market as a buyer, be sure you have a holistic grasp on your financial matters. Are you prepared to buy now, or should you rent for a little while longer? Our Rent vs. Buy calculator can help you figure that out.
- Consider refinancing. If you’re not quite ready to sell but need to better manage your payments, consider refinancing your mortgage. This could be especially beneficial if interest rates have dropped since the time your purchased your home. Take a look at our refinance guide for more information.
- Top-tier advice. For a fuller picture of how your money matters might be affected by a big decision like choosing to buy or sell a home, it’s extremely important to seek out the best financial advice, preferably from an expert. Finding the right financial advisor who fits your needs doesn’t have to be hard. SmartAsset’s free tool matches you with financial advisors in your area in just five minutes. If you’re ready to be matched with local advisors that will help you achieve your financial goals, get started now.
Questions about our study? Contact press@smartasset.com
Photo credit: ©iStock.com/kzenon