 Written by
U.S. home prices peaked in the years leading up to the Great Recession and fell dramatically when the housing bubble burst. In fact, national data from the House Price Index (HPI) shows that home prices dropped by 33% between April 2006 and March 2011. Though the economy has broadly recovered since then, home prices have not rebounded evenly nationwide. In this study, we determined which local housing markets have recovered the most and the least since the recession.
Using data from the Federal Housing Finance Agency (FHFA), we compared movements in the HPI for the 100 largest metro areas in the U.S. Specifically, we considered each metro area’s HPI change from its pre-crisis peak to trough, pre-crisis peak to current price and trough to current price. For details on our data sources and how we put all the information together to create our final rankings, check out the Data and Methodology section below.
Key Findings
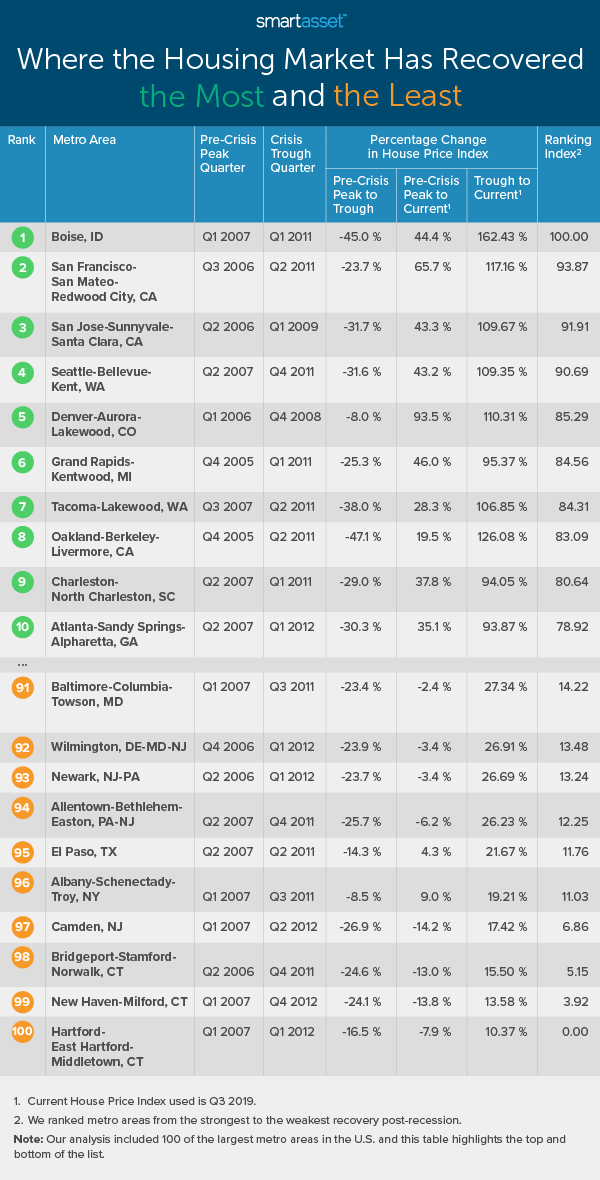
- Western housing markets have experienced stronger recoveries. The top five metro areas where the housing market has recovered the most are all located in the West, with three of them along the coast. All five of these metro areas have seen their HPIs more than double since they bottomed out during the Great Recession. In contrast, all five metro areas where the housing market has recovered the least are on the East Coast. In four of those five, the housing market has still not fully recovered.
- Peak and trough quarters vary. While the HPI peaked nationally in Q2 2006 prior to the recession and reached its lowest point in Q1 2011, the peak and trough quarters occurred at varying times in the 100 largest metro areas. The Warren and Detroit areas in Michigan had the earliest pre-crisis peaks in home prices (Q1 2005) while the Houston, Austin, Syracuse and Buffalo areas had the latest pre-crisis peaks (Q3 2008). The HPI troughs for large metro areas span an even longer time period of almost six years.
- Almost a quarter of metro areas have not fully recovered. Housing prices in 21 of the 100 largest metro areas have failed to reach pre-recession levels. In fact, in six metro areas, the most current HPI (from the third quarter of 2019) is more than 10% lower than it was at its pre-crisis peak.
The Five Places Where the Housing Market Has Recovered the Most
1. Boise, ID
Between the first quarters of 2007 and 2011, home prices in Boise, Idaho fell by more than 44%, about 11% more than the 33% drop nationally and the 17th-largest drop across all 100 metro areas in our study. However, from the crisis trough through the third quarter of 2019, home prices recovered by 162.4%, the highest rate for this metric across all 100 metro areas in the study. Additionally, from the pre-crisis peak in 2007 through the third quarter of 2019, home prices have grown by 44.4%.
2. San Francisco-San Mateo-Redwood City, CA
San Francisco-San Mateo-Redwood City, California ranks as the second metro area where the housing market has recovered the most since the Great Recession. In the second quarter of 2011, home prices hit their lowest point. Though home prices fell by about 24%, which ranks toward the middle of the study, San Francisco-San Mateo-Redwood City ranks in the top 10% of metro areas for its pre-crisis peak-to-current recovery as well as its trough-to-current recovery. Specifically, from Q3 2006 to Q3 2019, the HPI increased by 65.7%, and from Q3 2006 to Q3 2019, the HPI there increased by 117.2%.
3. San Jose-Sunnyvale-Santa Clara, CA
The House Price Index in San Jose-Sunnyvale-Santa Clara, California peaked in the second quarter of 2006, the same quarter as the national HPI. Dropping by a similar amount to the national HPI as well during the Recession, about 32%, the San Jose-Sunnyvale-Santa Clara HPI is currently 43.3% higher than its pre-crisis peak. San Jose is also the No. 1 city where homeowners spend the most on housing.
4. Seattle-Bellevue-Kent, WA
The HPI in Seattle-Bellevue-Kent, Washington fell by 31.6% during the housing crisis, the 29th-largest drop of the 100 largest metro areas in the U.S. Prices recovered significantly, however: From their lowest point during the Great Recession in Q4 2011, home prices in the Seattle area recovered by more than 109% in Q3 2019.
5. Denver-Aurora-Lakewood, CO
Since its pre-crisis peak in the first quarter of 2006 through the third quarter of 2019, home prices in Denver-Aurora-Lakewood, Colorado have grown by 93.5%, pre-crisis peak-to-current increase of any metro area in our study. Denver-Aurora-Lakewood ranks behind other metro areas in the West, because the housing crisis was felt less acutely there. According to FHFA data, between Q1 2006 and Q4 2008, the metro area’s HPI fell by only about 8%, the 14th-smallest drop of all 100 metro areas in our study.
The Five Places Where the Housing Market Has Recovered the Least
1. Hartford-East Hartford-Middletown, CT
Though home prices in Hartford-East Hartford-Middletown, Connecticut declined by less than 17% from Q1 2007 to Q1 2012, they have still not fully recovered. The Hartford area HPI was 7.9% lower in the third quarter of 2019 than it was at its pre-crisis peak in 2007. Additionally, from its lowest point in 2012 to Q3 2019, the HPI there has only grown by about 10%, the smallest percentage increase of all 100 metro areas in our study. Connecticut is also one of the worst states for the middle class.
2. New Haven-Milford, CT
South of Hartford-East Hartford-Middletown, New Haven-Milford, Connecticut ranks as the second metro area where home prices have recovered the least. Like in the Hartford area, the New Haven-Milford HPI peaked in the first quarter of 2007. From there, prices dropped by about 24%, only recovering 13.6% from trough prices to current prices.
3. Bridgeport-Stamford-Norwalk, CT
Bridgeport-Stamford-Norwalk, Connecticut has consistently ranked as one of our top places where residents earn the most from their investments. However, since the Great Recession, residents in the Bridgeport metro area have realized little gains on real estate investments. From its lowest point in Q4 2011 to its current point in Q3 2019, the Bridgeport-Stamford-Norwalk HPI has only increased by 15.5%, the third-smallest increase for this metric across all metro areas in our study.
4. Camden, NJ
Located across the Delaware River from Philadelphia, Camden, New Jersey saw relatively sharp declines in its housing market during the Great Recession. Its HPI dropped by almost 27% from the first quarter of 2007 to the second quarter of 2012. The housing market has since not recovered. In fact, Camden’s HPI was still about 14% lower in Q3 2019 than its pre-crisis peak.
5. Albany-Schenectady-Troy, NY
Of the five metro areas where the housing market has recovered the least, Albany-Schenectady-Troy, New York is the only place where Q3 2019 House Price Index was above its pre-crisis peak. However, from its lowest point in Q3 2011 to today, the Albany-Schenectady-Troy HPI grew by only 19.2%, which is the fifth-smallest increase across all 100 metro areas in our study.
Data and Methodology
The Federal Housing Finance Agency (FHFA) reports a quarterly House Price Index (HPI), a broad measure of the movement of single-family house prices, for the 100 largest metro areas in the U.S. Using HPI data from the beginning of 2000 through the third quarter of 2019, we identified when the housing market in each metro area peaked prior to the Great Recession and when it reached its lowest point.
First, we ranked each metro area according to the percentage change over three time periods:
- Pre-crisis peak to trough
- Pre-crisis peak to current (Q3 2019)
- Trough to current (Q3 2019)
Metro areas with the highest positive percent changes from the pre-crisis peak to current and trough to current were ranked highest as they reflect strong recoveries. Both of these metrics were single weighted.
We also wanted to account for how much home prices dropped during the recession. As a result, we half weighted the percent change from pre-crisis peak to trough. Larger drops were ranked highest because the recession had a greater effect on the housing market in those areas.
We then averaged the rankings of those three metrics. The metro area with the best average ranking, which is the housing market that recovered the most, received a score of 100 and the metro area with the lowest average ranking, which is the housing market that recovered the least, received a score of 0. Our ranking index shows how other metro areas stack up.
Note: We originally released this study on January 22nd. We updated the infographic and methodology for clarity on January 27th.
Tips for Investing in the Housing Market
- Make sure you can afford the cost of a home. Investing money in any single asset is risky. If you do invest in the housing market, make sure you invest in homes that you can afford. You may end up taking a big loss if the home depreciates and you can’t afford your mortgage. Our how much house can I afford calculator can help.
- Remember costs besides your mortgage. Though a mortgage is typically the largest expense for homeowners, other costs like property taxes and home insurance can add up. Our comprehensive home buying guide has a property tax calculator, budget calculator and many informative articles that can help you make smart decisions regarding housing.
- Consider a financial advisor. A financial advisor can help you make smarter financial decisions to be in better control of your money. That’s particularly important for those investing in the housing market. Finding the right financial advisor that fits your needs doesn’t have to be hard. SmartAsset’s free tool matches you with financial advisors in your area in five minutes. If you’re ready to be matched with local advisors that will help you achieve your financial goals, get started now.
Questions about our study? Contact us at press@smartasset.com
Photo credit: ©iStock.com/wichayada suwanachun