 Written by
The middle class is feeling the squeeze, as financial gains for this cohort have not kept pace with those of upper-income households. The median income of upper-income households in 1970 was 2.2 times the income of middle-income households, but by 2016, that ratio had increased to 2.4, according to Pew Research Center. Middle class families, who typically dream of taking out a mortgage to buy a home and elevating their station in life, are the backbone of America. With this in mind, SmartAsset decided to look at some of the states in America where the middle class is the strongest.
The middle class is generally defined as households with incomes between two-thirds to double that of the national median household income. As a result of data availability, we defined middle class as households earning between $35,000 and $100,000 for the purposes of this study. For details on our data sources and how we put the information together to create our final rankings, check out the Data and Methodology section below.
Key Findings
- The middle class thrives in the Midwest. Six of our top 10 states are located in the Midwest: Iowa, Nebraska, Indiana, South Dakota, Wisconsin and Minnesota.
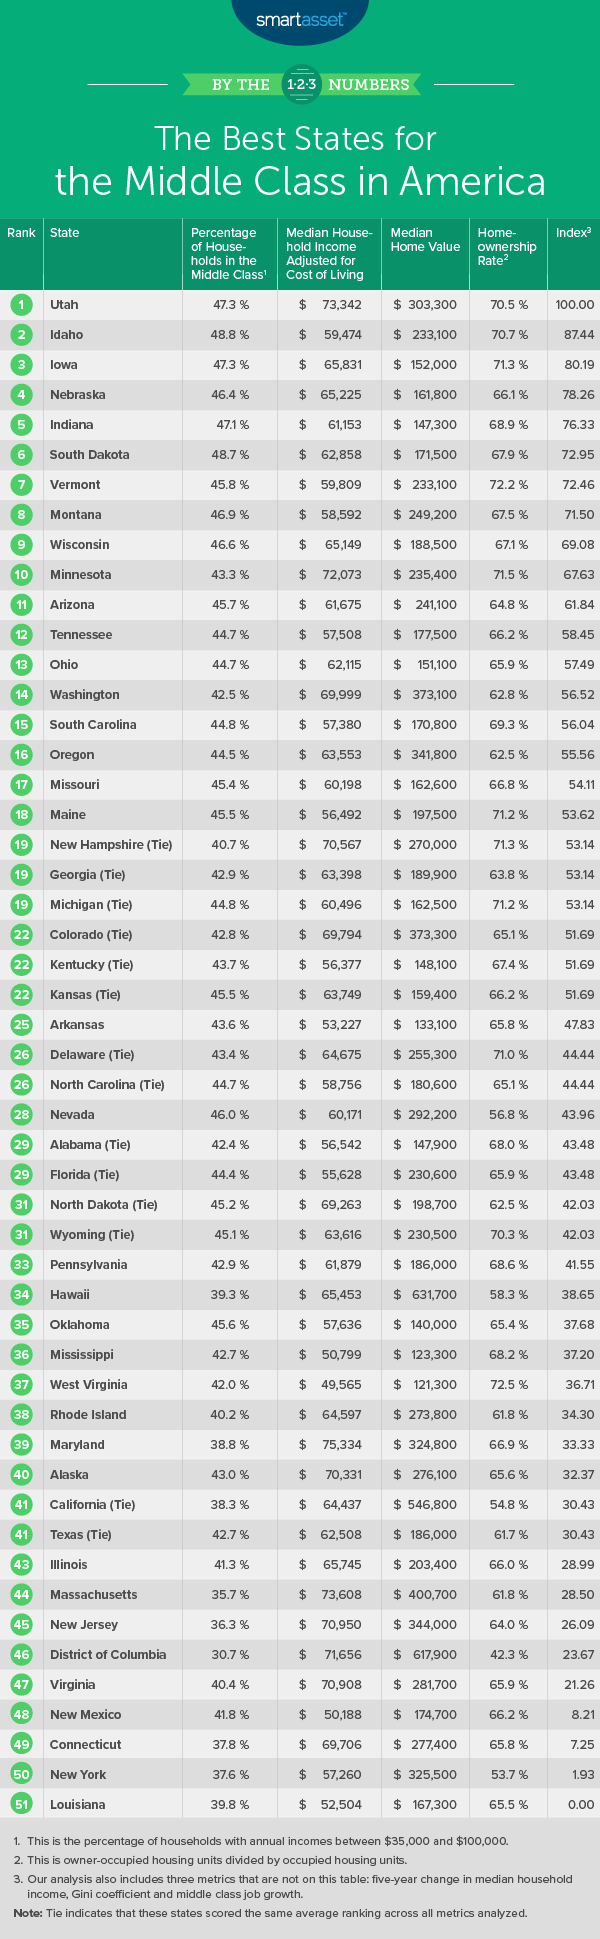
- There are wide ranges across many of the metrics we considered. The percentage of households in the middle class ranges across the study from 31% in the District of Columbia to 49% in Idaho. The median home value ranges from $121,300 in West Virginia to $631,700 in Hawaii.
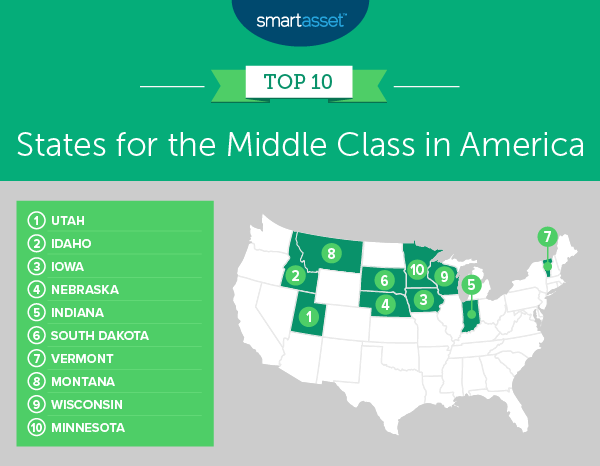
1. Utah
Utah ties for the third-highest percentage of households falling within the middle class. Approximately 47.3% of households in Utah made between $35,000 and $100,000 in 2018, suggesting that the middle class is stronger within the state than in many other places in the U.S. Utah has the lowest measure of income inequality of any state, with the lowest Gini coefficient. The Gini coefficient is a statistical measurement of wealth distribution using a scale of zero to one, where zero represents total equality and one represents total inequality across groups. The Gini coefficient in Utah was 0.43 in 2018. For comparison, the District of Columbia had the highest Gini index, at 0.52.
2. Idaho
Idaho has the largest middle class of any state and has seen the largest increase in middle class jobs. In 2018, 48.8% of households had annual incomes between $35,000 and $100,000, which is 1.5% more than in Utah. We defined middle class jobs as those with average earnings between $30,000 and $70,000. Between 2014 and 2018, there was an increase of 44.71% in jobs in Idaho with average earnings in that range. Of course, to see how far your paycheck will take you, make sure you use a cost-of-living calculator.
3. Iowa
Iowa ranks in the top 10 across all states for four individual metrics: percentage of households in the middle class, median home value, homeownership rate and Gini coefficient. In 2018, about 47% of households in Iowa made between $35,000 and $100,000 and the median home value was $152,000. Additionally, homeownership rates were high, with owners living in 71.28% of occupied housing units, and the Gini coefficient, which is a measure of income inequality, was 0.44.
4. Nebraska
Nebraska ranks in the top half of all states in all but two of the metrics we considered and does particularly well for percentage of households in the middle class, 46.4%, and Gini coefficient, 0.45. Additionally, homes in Nebraska are relatively inexpensive. The 2018 median home value was $161,800, the 11th lowest of any state. Despite this, however, homeownership rates are relatively low. Owners live in only 66.06% of occupied housing units were owner-occupied, ranking in the bottom half of all states for this homeownership metric.
5. Indiana
Homeownership is often characterized as the cornerstone of middle-class life in America. Owning a home may be more feasible in Indiana than in many other states. In 2018, the median home value was $147,300, the lowest of any state in our top 10 and fifth-lowest overall. Take a look at our home affordability calculator to see what kind of house you can afford.
6. South Dakota
South Dakota takes sixth place in our study on the best states for the middle class. It ranks second overall for the percentage of households in the middle class, at 48.7%. Median household incomes in South Dakota remained relatively flat in the five-year period from 2014 through 2018, increasing by only 10.39%. Furthermore, South Dakota has top-20 rates for median home value, homeownership rate and five-year middle-class job growth.
7. Vermont
Many residents in Vermont are homeowners. Census estimates show that 72.23% of occupied housing units are lived in by their owners, the second-highest percentage for this metric of any state. Vermont also ranks eighth overall for its Gini index – at 0.45 – and seventh overall its middle-class job growth from 2014 through 2018 – at 30%.
8. Montana
Median household incomes in Montana increased by 19.43% from 2014 through 2018, the most of any state in our top 10 and fourth-highest percentage overall. Montana ranks sixth overall for its percentage of households in the middle class, at 46.9%. Additionally, it has top-20 rates for homeownership rate, Gini index and five-year middle-class job growth.
9. Wisconsin
Wisconsin ranks in the top half of all states in all but one of the metrics we considered, middle class job growth. From 2014 through 2018, there was an increase of only 9.12% in the number of jobs that have average earnings between $30,000 and $70,000 in Wisconsin, the 10th-lowest rate across all states. Despite this, middle class statistics are strong for the other seven metrics we considered. In particular, a large percentage of the population in Wisconsin may be defined as middle class and income inequality is low. In 2018, almost 47% of households made between $35,000 and $100,000, the seventh-highest percentage in any state, and the Gini coefficient was 0.45, the ninth-lowest in the study.
10. Minnesota
Median household incomes in Minnesota have increased by 14.37% in the five-year period from 2014 through 2018. In 2018, the median household income adjusted for cost of living in the state was $72,073, the second-highest of any state in our top 10 and fourth-highest overall. Additionally, Minnesotans have high rates of homeownership. Of occupied housing units, 71.45% were owner-occupied, the third-highest across all states.
Data and Methodology
To find the best states for the middle class, SmartAsset looked at data for all 50 states along with the District of Columbia. We compared the states across the following seven metrics:
- Percentage of households in the middle class. This is the percentage of households with an annual income between $35,000 and $100,000, approximately two-thirds to two times the median national income. Data comes from the U.S. Census Bureau’s 2018 1-year American Community Survey.
- Median household income adjusted for the cost of living. This is the median household income adjusted for cost of living relative to the national average. The median household income was adjusted upwards if the state’s cost of living is lower than the national average or downwards if the state’s cost of living is higher than the national average.Data comes from the U.S. Census Bureau’s 2018 1-year American Community Survey and the U.S. Bureau of Economic Analysis.
- Five-year change in median household incomes. This is the percentage change in median household incomes between from 2014 through 2018. Data comes from the U.S. Census Bureau’s 1-year American Community Survey.
- Median home value. Data comes from the U.S. Census Bureau’s 2018 1-year American Community Survey.
- Homeownership rate. This is the number of owner-occupied housing units divided by total occupied housing units. Data comes from the U.S. Census Bureau’s 2018 1-year American Community Survey.
- Gini coefficient. This is a statistical measurement of income inequality. A Gini coefficient of zero indicates total equality of wealth distribution while a coefficient of one indicates total inequality of wealth distribution across groups. Data comes from the U.S. Census Bureau’s 2018 1-year American Community Survey.
- Five-year middle-class job growth. This is the increase in employment in jobs that earn an average annual income between $30,000 and $70,000. Data comes from the Bureau of Labor Statistics and is for 2014 and 2018.
To create our final score, we ranked each state in each metric. Then we found each state’s average ranking, giving equal weighting to all. We used this average ranking to create our final score. The state with the best average ranking received a 100. The state with the worst average ranking received a 0.
Tips for Finding a Home
- Make sure you can handle a mortgage. If you’re thinking about settling into a new or perhaps even a bigger home, recognize that a mortgage is a big commitment. Be certain you’ll be able to afford whatever you’ll end up having to pay. Use SmartAsset’s mortgage calculator to see the ideal range in which you should be shopping.
- Trusted personal finance advice. A financial advisor can help you make smarter financial decisions such as moving or being in better control of your money as you navigate finding a new job or helping a loved one pay for educational costs. Finding the right financial advisor who fits your needs doesn’t have to be hard. SmartAsset’s free tool matches you with financial advisors in your area in 5 minutes. If you’re ready to be matched with local advisors that will help you achieve your financial goals, get started now.
Questions about our study? Contact us at press@smartasset.com
Photo credit: ©iStock.com/peterspiro