 Written by
There comes a time in most people’s lives when they realize it is time to ditch the fifth-floor walkup studio apartment and move into a home big enough to raise a family in. You have to balance finding a home with enough room to accommodate your growing family, with living someplace close to employment and other opportunities. To that end, SmartAsset decided to find which cities are the best place in America to find a home big enough to raise a family in.
To locate the best places to find a home big enough to raise a family, we analyzed six different data points: change in home values, change in rent, percentage of housing cost-burdened homeowners, housing costs as a percentage of household income, percentage of homes with at least two bedrooms and average effective property tax rate. For details on our data sources and how we put it all together to create our final rankings, check out the Data and Methodology section below.
This is SmartAsset’s third study on the best cities to buy a family home. Check out the 2018 version of the study here.
Key Findings
- Westward ho! Nine of the 11 cities on this list are in Western states. A particularly large percentage of homes in those cities are family friendly, with two or more bedrooms. At least 80.0% of homes in those nine cities have two or more bedrooms.
- Think smaller. Big cities don’t tend to do well on this list. New York City, Philadelphia and Chicago are all in the bottom 15. The relatively high cost of living, including housing costs, makes it more difficult to find worthwhile housing with enough room in these cities.
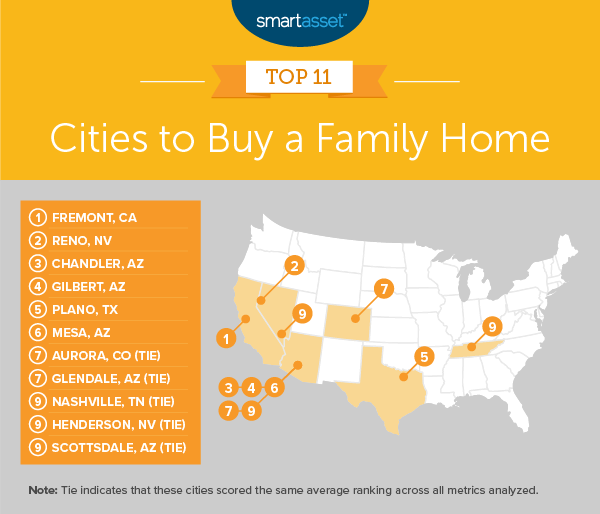
1. Fremont, CA
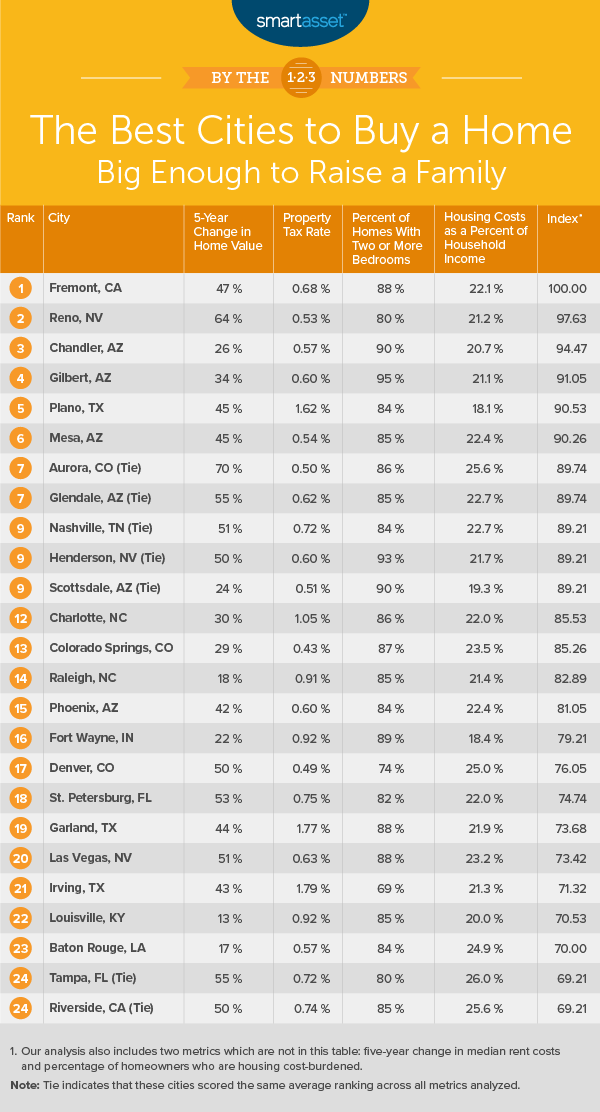
Fremont, California tops this list as the best place to find a home big enough to raise a family in. Home values in the city have gone up by 47% over the past five years. That’s the 21st-highest rate in our entire study. Fremont also has the third-highest five-year rent change in the study, at 37%.
The housing stock for families is robust: Approximately 88% of all homes in the city have at least two bedrooms. The effective property tax rate is 0.68% and ranks within the top 25% of the study for this metric.
2. Reno, NV
Reno, Nevada comes next, with the third-highest home value change from 2013 to 2017 out of all 100 cities in our study, at 64%. It also has the sixth-lowest effective property tax rate, 0.53%.
You might have a bit more trouble finding a big enough home in Reno than in some of the other cities on this list, as only 80% of the homes have at least two bedrooms, a rate that ranks 62nd overall. That said, only 19% of homeowners in Reno are housing-cost burdened, the 16th lowest rate in the study.
3. Chandler, AZ
Chandler is the first of four Arizona towns to make the top 11. It has seen average rents change just 13% in the past five years. Chandler also has the seventh-highest percentage in our study of homes having at least two bedrooms, at about 90%.
Just 19% of homeowners in Chandler are burdened by housing costs, a top-10 rate. Chandler’s home values, though, rose only 26% in the five years from 2013 to 2017, ranking 58th overall.
4. Gilbert, AZ
Gilbert, another city in Arizona, is next. Almost all of the homes in Gilbert – about 95% – have at least two bedrooms, making it second-highest ranked city in this study for this metric. If you’re looking for a home big enough for your family in Gilbert, there are plenty of options. Gilbert also has the 12th-lowest property tax rate in our study, at just 0.60%. Home values increased by about 34% from 2013 to 2017.
5. Plano, TX
Plano, Texas, a suburb of Dallas, comes in fifth. The median housing costs are just 18% of the median average salary in Plano. That’s the best rate in our study, and it shows that if you have a job in Plano you stand a good chance of being able to afford a home there. Just 19% of residents of Plano are housing cost-burdened. Plano is also the No. 2 city in the U.S. where women are most successful.
Homes values increased by 45% in the five years from 2013 to 2017, while rents went up 22% in the same period. Property tax rates are high at 1.62%, which ranks 75th out of all 100 cities on our list, so it’s important to keep that in mind as you continue your search for a home for you and your family.
6. Mesa, AZ
Mesa, Arizona has an average effective property tax rate of just 0.54%, the eighth-lowest rate in this study. This makes buying a home for your family more affordable, as you’ll be paying less to the government in property taxes each year. Almost 85% of homes in Mesa have at least two bedrooms – a rate that is not near the top of this study, but still within the top 40. From 2013 to 2017, home values increased 45% while rents increased by 19%.
7. Aurora, CO (Tie)
Aurora, Colorado ties for seventh place with Glendale, Arizona and stands out in our study for its large increase in home values – 70% – over the five-year period from 2013 to 2017. That’s the second-highest rate of growth out of all 100 cities in our study and shows that purchasing a family home in this Colorado city is a good investment decision as well as a chance to make a home for your family. It also has the fourth-lowest effective property tax rate at 0.50%. The Aurora metro area is also one of the best housing markets for growth and stability. Aurora doesn’t fare as well in the category of median housing costs as a percentage of median income – it stands at 25.6%, in the bottom third of the study.
7. Glendale, AZ (Tie)
The final Arizona city on this list is Glendale, and ties for seventh place with Aurora, Colorado. The city scores toward the middle of the pack for most of our metrics. Approximately 20% of its residents are housing cost-burdened. Home values increased by 55% while rents increased by 16% over the course of the five-year period we studied, from 2013 to 2017. About 85% of homes have at least two bedrooms and the average effective property tax rate is 0.62%, which are top-40 and top-20 rates, respectively.
9. Nashville, TN (Tie)
The first city in a three-way tie for ninth place this year is the Easternmost city in our top 11 – Nashville, Tennessee. Across all 100 cities in our study, Nashville has seen the eighth-highest change in rent over the five-year period from 2013 to 2017 at 26%. That makes the opportunity cost of not being a renter relatively high. Nashville also had the 13th-highest change in home value over the same period at 51%.
Around 21% of Music City residents are housing cost-burdened. The average effective property tax rate is 0.72%, a top-30 rate.
9. Henderson, NV (Tie)
Henderson, Nevada is the second city in our study that claims a spot in the three-way tie for ninth place. Henderson saw home values increase by 50% over 2013 to 2017 (a top-15 rate). Rents increased 10% over the same period. Most of the homes in the city – more than 93%, a top-5 rate – have at least two bedrooms, so there are plenty of options to find the perfect home to grow your family in. The average effective property tax rate is 0.60%, the 15th-lowest rate in the study. Henderson is also one of the most popular locations where retirees are moving.
9. Scottsdale, AZ (Tie)
The final city on our list is Scottsdale, Arizona. The change in rent from 2013 to 2017 in Scottsdale was a 16% increase, ranking 40th overall. The change in home value over the same period was an increase of 24% and the percentage of homeowners in Scottsdale that are housing cost-burdened is also 24%. While Scottsdale ranks in the bottom half of the study for both of these metrics, it has top-10 rates for the metrics of housing costs as a percentage of income, percentage of homes with at least two bedrooms and effective property tax rate. Approximately 19% of Scottsdale’s median household income consists of median housing costs. About 90% of the city’s homes have at least two bedrooms. The average effective property tax rate is 0.51%.
Data and Methodology
To rank the best cities to buy a family home, we examined data for 100 of the biggest cities in the U.S. Specifically, we examined the following six factors:
- 5-Year change in median home values. This is the percentage change in median home values. Data comes from the Census Bureau’s 2017 and 2013 1-year American Community Surveys.
- 5-Year change in median rent costs. This is the percentage change in median rent costs. Data comes from the Census Bureau’s 2013 and 2017 1-year American Community Surveys.
- Average effective property tax rate. Data comes from the Census Bureau’s 2017 1-year American Community Survey.
- Percentage of homes with at least two bedrooms. Data comes from the Census Bureau’s 2017 1-year American Community Survey.
- Median housing cost as a percentage of median income. This is median housing cost divided by median household income. Data comes from the Census Bureau’s 2017 1-year American Community Survey.
- Percentage of homeowners who are housing-cost burdened. This is the percentage of homeowners who spend more than 30% of their income on housing costs. Data comes from the Census Bureau’s 2017 1-year American Community Survey.
We ranked each city in each of our metrics. Next, we found the average ranking of each city, giving equal weight to each metric. Using this average ranking, we created our final score. The city with the best average ranking received a score of 100 while the city with the worst average ranking received a score of 0.
Tips for Finding an Affordable Home
- Look no further. If you’re struggling in your search for a suitable place for you and your family to live, consider finding a financial advisor to help you on your way. Finding the right financial advisor who fits your needs doesn’t have to be hard. SmartAsset’s free tool matches you with financial advisors in your area in 5 minutes. If you’re ready to be matched with local advisors that will help you achieve your financial goals, get started now.
- Can you afford it? It helps to know what your price range is before you start looking for a home. Use SmartAsset’s calculator to find out just how much house you can afford.
Questions about our study? Contact press@smartasset.com
Photo credit: ©iStock.com/Mikolette