 Written by
Parents often take multiple factors into account when thinking about where they want to raise their kids. Ideally, many would like to live somewhere safe where there’s a good school district, clean drinking water and plenty of activities for their kids to participate in when they’re not in the classroom. Cost of living matters as well. According to the USDA, the average cost of raising a single child is well over $304,000 when adjusting for inflation.
This is SmartAsset’s second annual study of the best places for children. Read the 2015 study here.
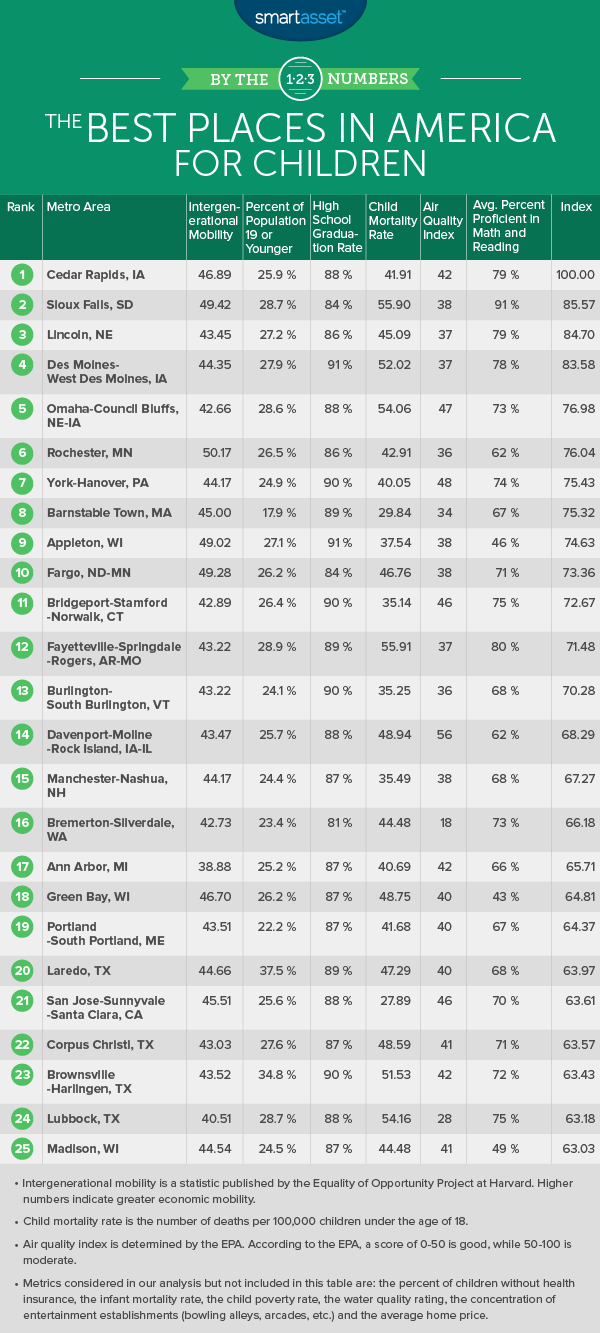
SmartAsset wanted to find the best places in America to raise a child. We looked at the 200 largest U.S. metro areas and ranked them using the same 13 factors that we included in our 2015 analysis. We focused on metrics that would affect a child’s quality of life, including water quality, air quality, intergenerational mobility and access to schools with high graduation rates and high rates of proficiency in math and reading.
We also looked at child and infant mortality rates, child poverty rates, median home values and the percentage of children without health insurance. (Read more about our methodology below.)
Plan ahead: Make sure you’re financially prepared for big life events with the help of a financial professional.
Key Findings
- Iowa’s on top. Cedar Rapids once again ranks as the best place in America to raise a child. Two other metro areas in the Hawkeye State also rank in the top 10.
- Florida’s at the bottom. Out of the 10 worst places to raise children, seven of them are located in Florida. Ocala comes in dead last in both the 2015 and 2016 editions of our study.
- Make your way to the Midwest. Many of the places that cracked the top 10 this year are familiar. Like last year’s study revealed, most of the best places for children based on our factors are located in the Midwestern portion of the U.S.
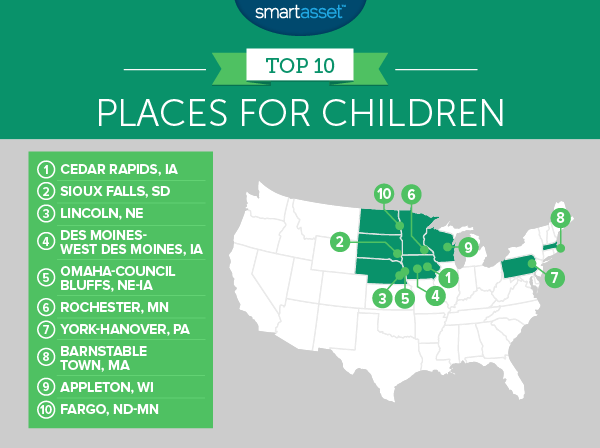
1. Cedar Rapids, Iowa
Cedar Rapids is the best place to raise a child according to this year’s (and last year’s) analysis. The metro area ranked well in last year’s analysis because of its high performing schools. Since then, its high school graduation rate has increased by 1.1% and the percentage of students with proficiency in language arts has increased by 4.1%.
Along with Appleton, Wisconsin, Cedar Rapids has the seventh highest concentration of kid-friendly establishments in our study. That means parents have quite a few options when it comes to keeping their kids entertained.
The metro area also ranks sixth when it comes to intergenerational mobility, meaning that children living in Cedar Rapids have a better chance of moving up the economic ladder than children in most other areas around the country.
2. Sioux Falls, South Dakota
For the second year in a row, Sioux Falls ranks second in our study of the best places for children. While it hasn’t moved in the rankings, the metro area has made progress toward reducing the achievement gap among its students when it comes to math and reading proficiency.
Out of all of the metro areas in our study, Sioux Falls has the highest percentage of students with proficiency in math and language arts (according to 2013-2014 data from the Department of Education). Since last year’s data analysis, the number of kids with proficiency in these two subjects has risen by 20%, on average.
Related Article: The States with the Best Schools
3. Lincoln, Nebraska
Conditions for children in Lincoln have improved slightly since our last study. The child poverty rate dropped by 4.4% and the percentage of uninsured children in the area fell by 15%. The percentage of households that have dealt with water quality violations in the Star City is still 0%, meaning that parents shouldn’t have to worry about having access to clean drinking water.
4. Des Moines-West Des Moines, Iowa
If you’re looking for a good place to raise a family, you may want to consider checking out Des Moines. A little more than 200,000 people live in Iowa’s capital city. Schools across the metro area have a high school graduation rate of 91% and the air quality index rating remains at 37, which indicates that its air is relatively clean.
You can find a number of museums, arcades and bowling alleys in the Des Moines metro area. But if you run out of things to do over the summer, you can always take your kids to the Iowa State Fair. It ranks as one of the best state fairs in America and it attracts visitors from countries around the globe.
5. Omaha-Council Bluffs, Nebraska-Iowa
The Omaha-Council Bluffs metro area remains in the No. 5 spot on our list of the best places for children in America. The median home value in the area is just $147,300. That means that it could be a good place to go house hunting if you’re tired of renting and you’re looking for an affordable place to settle down.
If that’s not enough to convince you to move to the Omaha metro area, maybe its 88% high school graduation rate or the fact that 0% of its households have dealt with water violations will help.
6. Rochester, Minnesota
There’s a reason why Rochester, Minnesota is known as the Med City. The Mayo Clinic has its headquarters there and millions of people from around the country have sought treatment and services from its physicians. Rochester is also home to more than 100 different parks, which could be perfect if you have kids who love to run around outdoors.
Although Rochester has slipped in the rankings since 2015, the metro area still ranks first in terms of upward mobility. Children born to poor parents in the 25th percentile (in the national income distribution) rank, on average, in the 50th percentile when they grow up.
Related Article: 13 Things to Know Before Moving to Minneapolis
7. York-Hanover, Pennsylvania
Children under the age of 20 make up a quarter of the population in the York-Hanover metro area. It’s another place with high graduation rates. About 90% of the students living there graduate from high school and nearly three-fourths of its students demonstrate proficiency in math and language arts.
8. Barnstable Town, Massachusetts
Barnstable Town is roughly 70.7 miles from Boston (by car). The metro area has the third highest percentage of insured children in our study. Just 2% of its children don’t have health insurance coverage. Barnstable Town also has the second lowest child mortality rate in our analysis.
In terms of the places with the highest number of entertainment venues for children per 1,000 businesses, Barnstable Town ranks first. In total, it has 24 museums and seven bowling alleys, according to data from the U.S. Census Bureau.
9. Appleton, Wisconsin
Appleton ranked ninth in both the 2015 and 2016 editions of our study on the best places for children. While less than 50% of its students are proficient in math and reading, the metro area ranks well when it comes to its air and water quality. Plus, it’s among the metros with the highest high school graduation rates.
10. Fargo, North Dakota-Minnesota
Fargo is the largest city in North Dakota. While more than 116,000 people live there, the Fargo metro area is home to about 228,000 people (according to the U.S. Census Bureau).
Children make up about 26% of the area’s population and the kids who live there have a high chance of being upwardly mobile. If they continue living in Fargo as adults, they could land jobs at North Dakota State University or Microsoft, which are two of the area’s major employers.
Methodology
In order to find the best places in America for children, we took the 200 largest metro areas in the country and ranked them across 13 different metrics. We only included the U.S. metros with a population of more than 200,000 people.
To complete our study, we looked at the percentage of people in each metro area who are under the age of 20. We focused on environmental factors such as the percentage of households with water quality violations and average air quality index ratings (based on 2015 data from the EPA). We also considered health-related factors such as the percentage of uninsured children in each metro area, the child mortality rate (deaths per 100,000 children below the age of 18) and the infant mortality rate (deaths per 100,000 births).
We assumed that parents preferred to raise their children in areas with a low cost of living and plenty of economic opportunity. So we looked at median home values as well as child poverty rates and absolute upward mobility (which Harvard researchers use to measure children’s economic outcomes, based on the expected rank of a child born to parents at the 25th percentile in the national income distribution). We wanted to account for children’s access to fun activities as well, so we found the concentration of entertainment establishments (including theme parks, museums and zoos) per 1,000 businesses.
Finally, we looked at three education-related metrics from the 2013 – 2014 school year: high school graduation rates across each metro area school district, the percentage of students proficient in math and the percentage of students proficient in reading and language arts. Graduation rates are weighted depending on the size of the student population in each metro. (Note: Wichita, Kansas and Topeka, Kansas were omitted from the study because they did not have education data available.)
Once we pulled our data, we ranked all of the metro areas, giving full weight to 11 of the factors and half-weight to both our water quality and air quality factors. We then averaged our rankings and gave each metro area a score between 0 and 100. The highest ranking metro received a 100 while the lowest ranking metro area received a 0.
Data Sources
Data on median home values, the percentage of children in each metro area, the child poverty rate and the concentration of kid-friendly entertainment establishments are 2014 figures from the U.S. Census Bureau. Data on mortality rates and the percentage of uninsured children reflect 2015 figures from countyhealthrankings.org. Data on water quality reflects 2014 figures from countyhealthrankings.org.
Our air quality data comes from the Environmental Protection Agency and is the 2015 median AQI. Data on intergenerational mobility comes from Harvard’s Equality of Opportunity Project. Data on high school graduation rates and proficiency in math and language arts come from the U.S. Department of Education.
The data analysis for this study was completed by Nick Wallace.
Questions about our study? Contacts us at blog@smartasset.com.
Photo credit: ©iStock.com/Christopher Futcher