 Written by
The Great Recession lasted from late 2007 to mid 2009. It was the longest recession since World War II and had huge impacts on the U.S. economy. Investors lost big as the S&P 500 Index fell 57%. The housing market crashed and home values fell about 30%. National unemployment rose to a peak of about 10% in late 2009. Almost a decade after the start of the Great Recession, conditions have improved in many places.
After considering multiple economic factors, like unemployment and income growth, SmartAsset has created a list of the cities that have recovered the most since the recession.
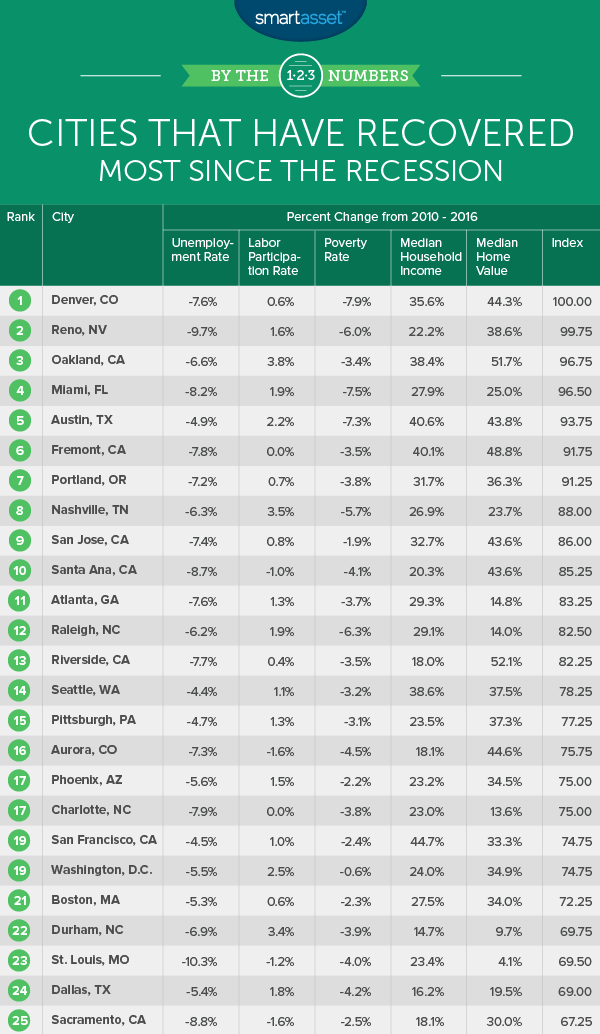
We considered five metrics. Those metrics are the change in unemployment rate, the change in the labor participation rate, the change in poverty rate, the change in median household income and the change in median home values. We used 2010 as our earliest point of comparison because, according to the U.S. Census Bureau, national unemployment peaked in 2010. You can read the data and methodology section below to learn more about our data sources and how we found our top cities.
Key Findings
- Big changes in California – Four of the top 10 cities are in California. One factor that helped these cities rank so high was a large increase in home values. The four California cities all saw their home values increase by at least 43% between 2010 and 2016.
- A low ranking isn’t necessarily bad – The cities at the bottom of our ranking saw the least change across our five metrics from 2010 to 2016. However, some of those cities may not have been hit as hard by the recession to begin with. Chesapeake, Virginia comes last in our study partially because its unemployment rate has only changed by 1.3%. But it’s unemployment rate was only 6.2% in 2010, which was the second-lowest of the 100 cities we considered.
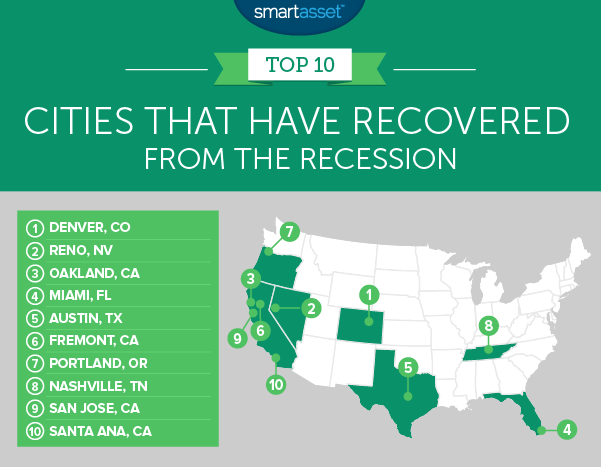
1. Denver, Colorado
Denver comes in at the top of our study thanks to big improvements across almost every metric. Unemployment decreased from 11.9% in 2010 to just 4.3% in 2016. The poverty rate decreased 7.9% from 2010 to 2016. That was the largest decrease for any city in our study.
Denver’s housing market has also done well. Home values rose 44.3% since the recession. That’s the fifth-largest increase of the cities we looked at. Not to be outdone, household incomes also grew 35.57% – sixth-highest.
With all these great improvements (not to mention the numerous museums, thriving art scene and beautiful nature) it’s no surprise that Denver’s population has grown 14% since 2010. In particular, a large number of millennials are moving to Denver.
2. Reno, Nevada
The recession hit Reno, Nevada hard. The unemployment rate in the city peaked at 16% in 2010 (compared to 11.3% in 2009 and 6.1% in 2008). Reno’s unemployment rate in 2016 was down to 6.3%. That’s a decrease of 9.7% (the study’s fourth-largest decrease) and it brings Reno close to pre-recession levels.
Reno also saw the study’s fifth-largest largest decrease in poverty rate (from 21.1% down to 15.1%) and also had a 38.62% increase in home values.
Reno boasts some of the strongest financial advisor firms in Nevada, which we highlight in our Reno top financial advisor list.
3. Oakland, California
From 2010 to 2016, Oakland’s labor force participation rate went from from 65% to 68.3%. That increase (3.8%) is the second-largest in our study. With the increase in labor force participation, unemployment decreased 6.6%. That’s a great improvement but is actually low (33rd overall) when compared to other cities we looked at.
The city’s housing market has also done well and Oakland had our study’s second-largest increase in home values. The median home value grew from $428,200 to $649,700. That’s a 51.7% increase and values are even higher than pre-recession levels. (Oakland’s median home value was $595,000 in 2007). Rising home values aren’t always a good thing, but household incomes in Oakland have also risen over 38% since 2010. That’s the fifth-largest increase in this study.
4. Miami, Florida
According to the U.S. Census Bureau, poverty in Miami decreased 7.5% from 2010 to 2016. That’s the second-highest decrease in our study. However it’s worth noting that Miami’s poverty rate in 2016 was 24.9%. That’s still the 14th-highest of the cities we looked at.
On a brighter note, the unemployment rate in Miami has decreased every year since 2010. It was at 6.8% for the end of 2016 after hitting a high of 15% in 2010. Miami hasn’t quite reached pre-recession unemployment rates (unemployment was at 4.9% in 2007) but it is getting close.
5. Austin, Texas
Austin has made big strides since the recession. It ranked in the top 10 for four of our five metrics. Home values rose 43.8% (sixth-highest) and household incomes went up 40.6% (second-highest). The poverty rate decreased 7.3% in Austin, the third-largest decrease in our study.
The one factor that kept Austin from ranking even higher was the relatively low change in unemployment rate. That isn’t necessarily a bad thing though. Austin’s unemployment, which was at 8.4% in 2010, shrank to 3.5% in 2016. That’s well below the national unemployment rate (5.8% in 2016). However, the other cities in our top 10 all saw unemployment go over 10.5% in 2010 and then decrease by over 6% over the next six years. (Austin’s unemployment decreased 4.9%.)
6. Fremont, California
Fremont ranks in our top 10 thanks largely to its changes in home value and income. Between 2010 and 2016, the median home value in Fremont rose from $590,000 to $877,700. That’s an increase of over 48% and is also the third-largest increase in our study. It’s no surprise that home values have increased so much. Fremont has drawn new residents as one of the safest and most livable cities in America.
Along with increasing home values, Fremont has seen median household incomes go up by 40%. The median income of $122,419 in Fremont is the highest in our study. The city also had the lowest poverty rate (just 3.1% in 2016) out of the cities we considered.
7. Portland, Oregon
Portland’s economy has done well in the years since the Great Recession. For starters, unemployment has steadily dropped since 2010. It was at just 5% in 2016. That’s lower than pre-recession rates (6.5% in 2007). Median household incomes have also grown 31.67%, which is the ninth-highest increase in our study.
8. Nashville, Tennessee
Nashville is the easternmost city in our top 10. One reason that it ranks so high is that Nashville saw an increase of 3.5% in labor force participation between 2010 and 2016. That is the third-largest increase of all the cities we looked at.
The city also saw a large decrease in its poverty rate. After hitting 20.8% in 2010, the poverty rate decreased to 15.1% in 2016. That’s a change of 5.7% (eighth-largest change in poverty rate).
Nashville also had our study’s 15th-highest increase in median household income. After dropping to $42,813 in 2010, the median income rose $11,497 to hit $54,310 in 2016.
9. San Jose, California
Between 2010 and 2016, the median household income in San Jose, California rose 32.74%. That’s the seventh-highest income growth in our study and one of the big reasons that San Jose is in the top 10.
Median home values in San Jose also increased by 43.57%. That’s our study’s eighth-highest percent increase in home value. In fact, the median home value went up almost a quarter of a million dollars from $558,600 in 2010 to $802,000 in 2016. Only two other cities in our study (San Francisco,California and Fremont, California) saw home values increase by more.
10. Santa Ana, California
Since it’s 2010 peak of 14.4%, Santa Ana, California saw unemployment shrink to 5.7%. That 8.7% decrease is the seventh-largest of all the cities we considered. Another reason Santa Ana made our top 10 was its 43.62% increase in home values. That’s our study’s seventh-largest percentage increase in median home value.
However, household incomes haven’t grown quite as quickly. Santa Ana residents only saw an increase of about 20% between 2010 and 2016.
Data & Methodology
We determined which cities have recovered most since the recession by considering five metrics. The metrics all look at changes between the years of 2010 and 2016. We chose 2010 as our earliest comparison point because it is the year that unemployment peaked nationally (according to data from the U.S. Census Bureau). To ensure we had the most accurate data available, we considered the 100 largest cities in the U.S. for this study, based on 2016 population data from the Census Bureau. The five metrics we used were
- Change in unemployment rate. Data comes from the Census Bureau’s 1-Year 2010 and 1-Year 2016 American Community Survey.
- Change in the labor participation rate. Data comes from the Census Bureau’s 1-Year 2010 and 1-Year 2016 American Community Survey.
- Change in the poverty rate. Data comes from the Census Bureau’s 1-Year 2010 and 1-Year 2016 American Community Survey.
- Change in median household income. Data comes from the Census Bureau’s 1-Year 2010 and 1-Year 2016 American Community Survey.
- Change in median home value. Data comes from the Census Bureau’s 1-Year 2010 and 1-Year 2016 American Community Survey.
In order to rank the cities, we combined all five metrics and found each city’s average ranking across the metrics. All metrics received equal weighting. We used the average rankings to create our final score. The city with the best average ranking received a score of 100 and the city with the worst average ranking received a score of 0.
Tips to Help You When Money Is Tight
- One well-known result of the Great Recession was a rise in unemployment. According to the Federal Reserve Bank of New York, national unemployment hit 10% in October 2009. If you have a hard time making enough to get by, then you might want to consider a side hustle. Even if you have a full-time job, it’s always helpful to earn more on the side. You could consider renting out a room in your house on Airbnb, becoming an Uber driver and baby-sitting. That extra money could go toward your retirement savings.
- When money is tight, many people look to cut back and save money. However, many Americans don’t use a budget. Creating a realistic budget is a great way to help you spend on the important things and cut back on the other things.
- For some people, moving might be a feasible option for finding a higher-paying job. Not all cities offer the same opportunities, so you might want to check out some of our top cities for career opportunities. Naturally, parents also want to live in a place that is well-suited for children. Working parents probably want to live in a safe place with low child care costs and high incomes. Luckily, we considered all those factors in our study of the best cities for working parents.
Questions about our study? Contact us at press@smartasset.com.
Photo credit: ©iStock.com/Davel5957