 Written by
When it comes to paid family leave, the United States is behind the curve. The U.S. is the only industrialized country in the world without a paid parental leave policy for new parents in place at the national level. And according to the U.S. Department of Labor, only 12% of private sector workers had access to paid family leave through their jobs in 2015. Since most parents in America are working parents, these are startling statistics.
Compare current mortgage rates here.
The number of parents choosing to work outside of the home is increasing. According to the Bureau of Labor Statistics, the number of families with at least one working parent rose from 88.7% in 2014 to 89.3% in 2015. In 60.6% of families with married couples, both parents work.
Paid parental leave is more necessary than it has ever been. But even in states that rate well for their family leave policies (like California and New York), there’s a need for additional legal protections for new and expecting parents.
Read the 2016 edition of this annual study.
Study Specifics
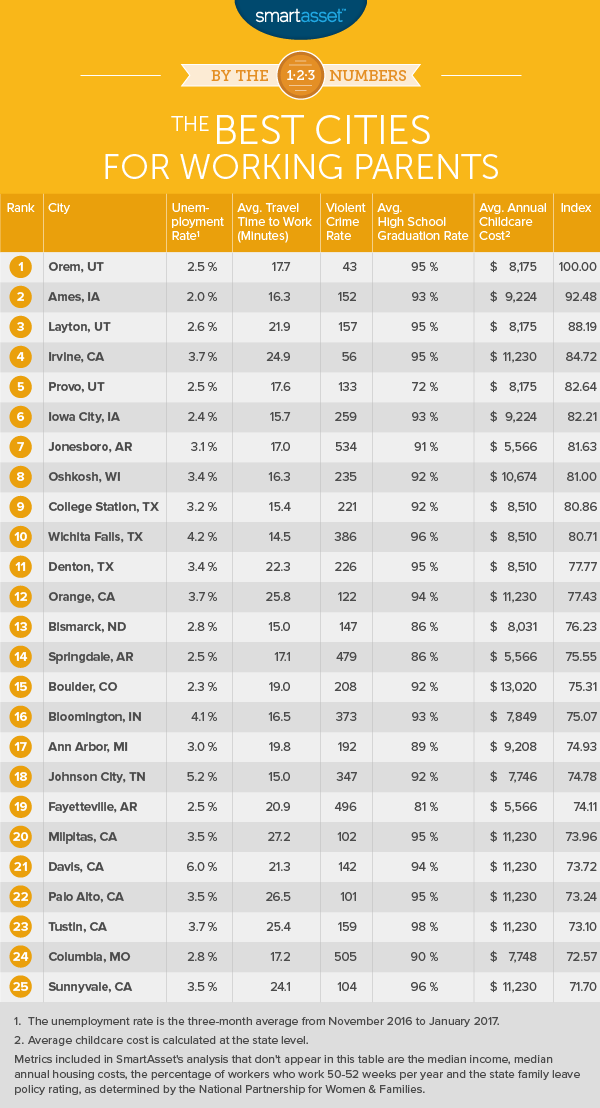
SmartAsset wanted to find the best cities for working parents. So we ranked 464 of the largest U.S. cities using nine factors, including the unemployment rate, the average high school graduation rate and the violent crime rate. We also looked at household income, average childcare costs, housing costs and average commute time.
Much like we did in the 2016 edition of our study, we considered a rating of the family leave policies in every state. To learn more about how we conducted our analysis, read the data and methodology section below.
Key Findings
- Orem does it again. For the second consecutive year, this small town in Utah ranks as the best place for working parents.
- Childcare costs are rising. Since we published the 2016 edition our study, the cost of childcare for children up to age 4 has risen in almost every state. In places like Colorado, it has risen by more than 15% since 2014.
- California earns an A for its family leave policies. Seven cities in California rank among the top 25 cities for working parents. In 2015 the Golden State passed laws that offer paid sick days to many parents who need time off for prenatal and children’s doctor’s appointments.
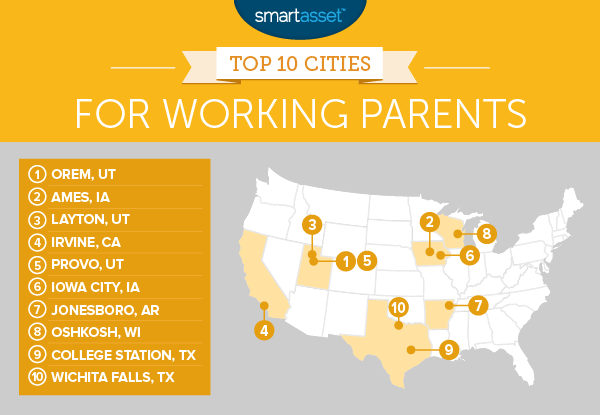
1. Orem, Utah
Orem ranks well across multiple categories in our study. With a low violent crime rate (43 crimes per 100,000 residents), it’s one of the safest cities in our analysis. What’s more, the local high school graduation rate is high. On average, 95% of the city’s high school students earn their diplomas.
In a recent SmartAsset study, Orem ranked as one of the top boomtowns in the country. Parents who need to work full-time to support their families can benefit from the city’s strong economic growth and development. Just 2.5% of the residents in Orem who are actively looking for work are unemployed.
2. Ames, Iowa
Ames ranks as the second-best city for working parents. Out of the 464 cities in our study, it has the lowest unemployment rate (2%). Ames is also an affordable city to live in. A typical household spends around 24.65% of its annual income on housing costs, including property taxes, mortgage and rent payments and homeowners insurance.
Most folks in Ames (59%) work less than 50 weeks out of the year. Working parents with at least two weeks off from work can spend more quality time with their children.
3. Layton, Utah
Layton, Utah is less than 30 miles away from Salt Lake City. With a median household income of $73,242, it’s one of the wealthiest cities in Utah. Average annual childcare costs in Utah are $8,175. So a typical family in Layton may only spend around 11.16% of its annual income on childcare for kids up to age 4.
4. Irvine, California
Irvine ranks as a great place for working parents. Since the city’s violent crime rate is relatively low (56 crimes per 100,000 residents), parents don’t have to be as concerned about safety as their counterparts in other areas of the country. Schools are good for local public school students and those within California’s higher education system. The average high school graduation rate in Irvine is 95%.
Unfortunately, childcare costs in California are high despite the high median incomes for families across the state. The average household in Irvine can expect to spend about 11.97% of its annual income on childcare expenses. That’s slightly higher than what most families report spending on childcare nationwide.
5. Provo, Utah
Provo has moved up several spots since we released the 2016 edition of our analysis. Last year, it ranked as the ninth-best place for working parents. In a year, its unemployment rate fell from 2.7% to 2.5%. Its violent crime rate dipped slightly and the average commute time in the city dropped from 18.4 minutes to 17.6 minutes.
The average high school graduation rate in Provo remains below the national average. But local schools have made progress. The graduation rate is now 72%, up from 69% in our 2016 study.
6. Iowa City, Iowa
Iowa City is the fifth-largest city in Iowa. The unemployment rate is low (2.4%) and the average high school graduation rate is high (93%). The average commute time for residents traveling to work is just 15.7 minutes. Working parents who want to ensure that their children have access to clean air and a high quality of life will be happy to know that Iowa City recently ranked as a top green city for families.
7. Jonesboro, Arkansas
At face value, childcare costs in Arkansas are lower than they are in most parts of the country. On average, the cost of caring for children in the state from infancy to age 4 is just $5,566. But this means that families in Jonesboro who earn the median household income ($38,094) spend around 14.6% of their annual income on childcare. Yikes.
On the bright side, working parents living in Jonesboro benefit from a strong local economy. The unemployment rate is around 3.1%. Key industries in the city include healthcare and education.
8. Oshkosh, Wisconsin
Oshkosh ranks at the eighth-best place in America for working parents, down from seventh place in the 2016 edition of our analysis. The city rates particularly well for its affordability. The average household only spends 21.35% of its income on housing-related expenses.
A recent report from the National Partnership for Women & Families gave the state of Wisconsin a C for its family leave policies. There’s still plenty of room for improvement. But the Badger State earned points for giving workers more access to job-protected family leave than federal laws. There’s also flexible paid sick time that parents can use to care for a new child.
9. College Station, Texas
Living in College Station, Texas has its perks. Unemployment is relatively low (3.2%) and the average high school graduation rate is high (92%). Plus, the Lone Star State doesn’t have a personal income tax. This means that working parents have more room in their budgets for childcare costs. The average annual cost of childcare in Texas is $8,510.
10. Wichita Falls, Texas
Americans across the country have long and stressful commutes. And traveling back and forth to work is costly. A recent report from the Citi ThankYou Premier Commuter Index revealed that the average cost of commuting is around $2,600. Fortunately, the average commute in Wichita Falls isn’t that long. Local residents spend just 14.5 minutes traveling to work. That’s the third-shortest commute in our study.
Median annual housing costs in Wichita Falls have risen by 2.84% since we published the 2016 edition of our analysis. But a low cost of living and good schools make the city a great place to raise a family. The average high school graduation rate (96%) is among the highest rates in our study.
Data & Methodology
To find the top cities for working parents, we compared 464 of the largest U.S. cities using the following metrics that we took into account in last year’s analysis:
- Median household income. We used one-year estimates from the U.S. Census Bureau’s 2015 American Community Survey.
- Median annual housing costs. We looked at multiple costs associated with owning a home, including property taxes, homeowners insurance, mortgage payments and rent payments. These are one-year estimates from the 2015 ACS.
- Average commute time. We looked at how long it takes to travel to work (in minutes) in each city. These are one-year estimates from the 2015 ACS.
- Unemployment rate. We looked at the average unemployment rate over the course of a three-month period between November 2016 and January 2017. This data comes from the Bureau of Labor Statistics.
- Violent crime rate. This is the number of violent crimes per 100,000 residents. We used data from state and local police department websites and the FBI Uniform Crime Reporting system.
- Average high school graduation rate. We looked at the weighted average for graduates of local schools in each city. This is 2015-2016 school year data from the U.S. Department of Education.
- Percentage of workers who work more than 49 weeks per year. This data is based on one-year estimates from the 2015 ACS.
- Average cost of childcare. This metric considers the average annual cost of childcare from infancy to age 4. The data comes from Childcare Aware of America.
- State policy rating. This metric is a score created by the National Partnership for Women & Families. It rates all 50 states based on the level of support that they offer working parents. A higher score is an indication of a state with laws and policies (such as paid sick days and paid family leave) that are more accommodating to new parents and pregnant women in the workplace.
We ranked each city in our study using all nine of our metrics. Then, we averaged those rankings, giving full weight to each factor. In the end, we created an index and gave each city a score between 0 and 100. The top-ranking city scored 100 and the lowest-ranking city scored 0.
Nick Wallace completed the data analysis for this study.
Questions about our study? Contact us at press@smartasset.com
Photo credit: ©iStock.com/omgimages