 Written by
When it comes to raising children location is important. Parents want their children to have the opportunity to attend the best schools and also to enjoy their childhoods and make friends. But many places with the best schools and the best economic opportunities tend to be the least affordable. SmartAsset considered these and other metrics to find the best places for children in 2017.
Looking to move your family? Check out how much home you can afford.
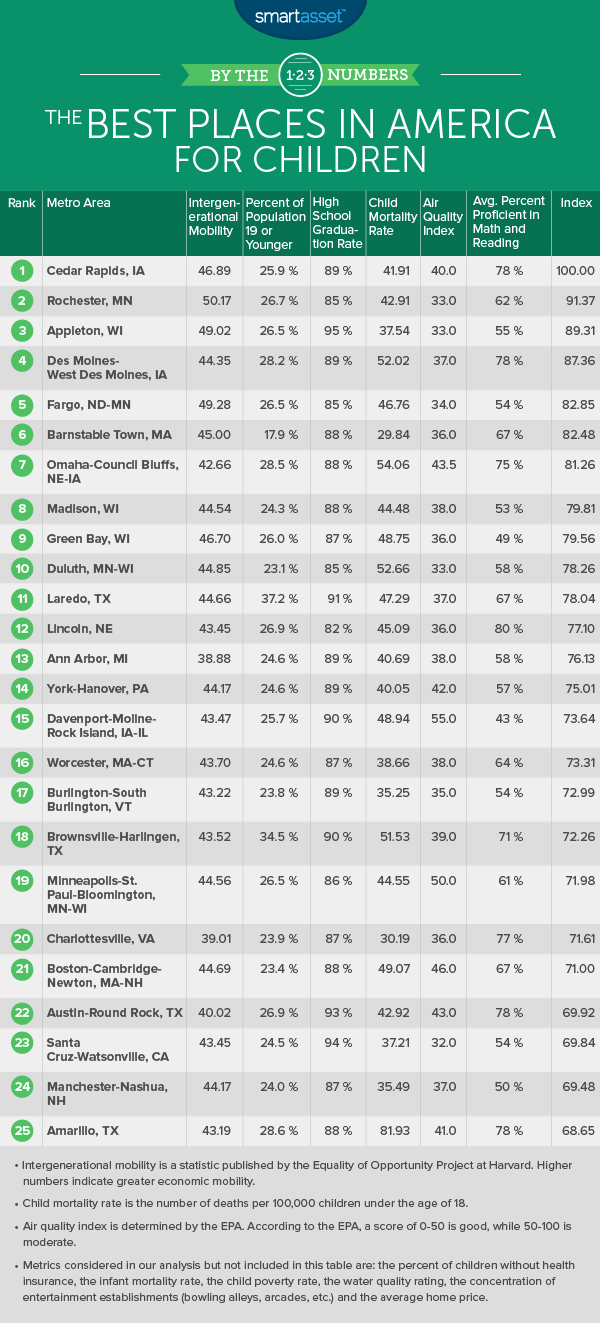
In order to find the best places for children, we analyzed data on 198 metro areas. We gathered data on metrics like percent of kid-friendly establishments, median home value, high school graduation rate, math proficiency rate, language arts proficiency rate, child poverty rate, percentage of population under age 20, air quality, water quality, intergenerational mobility, infant mortality rate, child mortality rate and the percent of children who are uninsured. Check out our data and methodology section below to see where we got our data and how we put it together.
This is SmartAsset’s third annual study on the best places for children. Read the 2016 version of the study here.
Key Findings
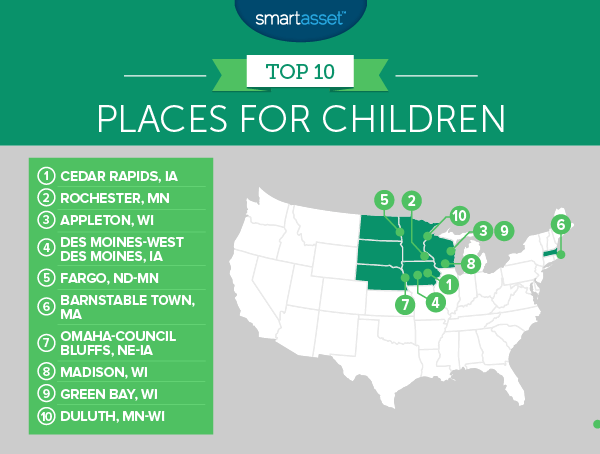
- Three-time champ – For an impressive three years in a row, Cedar Rapids is the best place for children in America. The Cedar Rapids area has some of the best schools and highest-performing students in the country. It also scores high marks for intergenerational mobility.
- Move to the Midwest – All but one of the top 10 places for children are in the Midwest. Midwest metro areas tend to do a good job graduating students and come with plenty of entertainment options for local children.
- Struggling South – Last year, we highlighted Florida as the state which was letting its children down. This year Florida improved with only one Sunshine State metro area in the bottom 10 places for children. However, Southern metros still dominate the bottom of this list, claiming seven of the 10-lowest spots.
1. Cedar Rapids, Iowa
Cedar Rapids is once again the best place for children in the country. Some of its scores have improved since last year’s study. For example the graduation rate rose from 88.49% to 88.53%, and language arts proficiency rate rose from 76.92% to 79.56%. That language arts rate is the second-highest in the study.
In other metrics Cedar Rapids did not score as well as it did last year. The area’s math proficiency rate dropped from 80.32% to 76.34%. The child poverty rate also increased from 11.9% in last year’s study to 13.4% in this year’s study.
2. Rochester, Minnesota
Rochester climbed from six in last year’s study to claim second in this year’s study. Med City improved its scores in language arts proficiency, child poverty rate and percentage of population under 20.
The best argument for why Rochester is great for children is its intergenerational mobility score. No metro area in the study gives children a better shot at moving up the income ladder than Rochester. This area also scores well in environmental factors like air quality and water quality.
3. Appleton, Wisconsin
Appleton catapulted from ninth last year to third this year. This metro area has the ninth-highest percentage of establishments which are kid friendly, including five arcades and eight bowling alleys.
The area also has the highest graduation rate in the study. Over 94% of Appleton students graduate. However Appleton’s reading and math scores show room for improvement. Only 51% of students are proficient in language arts and 58% are proficient in math.
4. Des Moines-West Des Moines, Iowa
Des Moines-West Des Moines occupies the same spot it did in last year’s study. This metro area finds itself ranked so high thanks to the quality of the education children can receive in the area. Des Moines-West Des Moines scores in the top 10 in both language arts proficiency and math proficiency. Not even Cedar Rapids scores in the top 10 for both.
Another good sign is the area’s declining child poverty rate. The area saw a steep decline in the percent of children who are living in poverty. In last year’s study this rate was 17.1%, and this year it fell to 13.8%. At the same time the percent of the population who are children rose. Last year’s study showed 27.9% of the population were under 20. This year that number has risen to 28.2%.
5. Fargo, North Dakota-Minnesota
Fargo vaulted five spots from last year to claim this year’s fifth place. This area had particularly strong finishes in three metrics: child poverty rate, intergenerational mobility and percentage of households with a water quality violation. Fargo scored in the top three in each of these metrics.
If Fargo wants to climb further into the top five, it will need to improve on education. Only 53% of Fargo students are proficient in language arts and just under 55% are proficient in math. Both of those scores are low for the top 10.
6. Barnstable, Massachusetts
Barnstable is the only metro area outside of the Midwest to break into our top 10. This cape town is a fun place for both children and adults. It comes with great beaches as well as plenty of kid-friendly establishments, including 22 museums and seven bowling alleys. In total, 0.45% of establishments in Barnstable are kid-friendly entertainment establishments.
7. Omaha-Council Bluffs, Nebraska-Iowa
Omaha-Council Bluffs dropped two spots from last year mostly due to the increase in median home value. An increase in median home value is great for the people who own homes, but makes it harder for other residents to become homeowners. Omaha also saw child poverty rates rise from 14.6% in last year’s edition to 18.3% in this year’s study.
But on average Omaha-Council Bluffs scored well and earned its place in the top 10. For example, 78% of kids are proficient in math. That’s the third-highest score in the study. Omaha also gives children plenty of opportunities to have fun and make friends. Over 28% of the population in Omaha are under the age of 20.
8. Madison, Wisconsin
Madison is a great place for everyone. We rated it as one of the best state capitals to live in and one of the best college towns.
The area jumped an impressive 17 spots from 25th last year to eighth this year. Madison owes its jump in the rankings to its decreasing child poverty rate and improved air quality. It ranked sixth overall in child poverty and 48th for quality of air.
9. Green Bay, Wisconsin
Madison’s neighbor to the northeast, Green Bay, takes the second-to-last spot in our top 10. Green Bay scores well in both air quality and water quality. No families dealt with water quality violations in 2014, meaning parents do not need to be concerned with the drinkability of their tap water. Green Bay also has a median air quality index of 38, one of the best scores in the top 10.
10. Duluth, Minnesota-Wisconsin
Duluth just squeaks by Laredo, Texas to take the final spot in our top 10. Around 0.4% of all establishments in the Duluth area are kid-friendly. That’s the second-highest rate in the top 10. This means kids in the area have plenty to do.
In terms of home affordability Duluth also scores well. The median home value in Duluth is $147,300 – the lowest in the top 10.
Data and Methodology
In order to find the best places for children, SmartAsset gathered and analyzed data on 198 metro areas. Specifically we looked at the following 13 metrics:
- Children’s entertainment establishments. This is the percent of establishments in a metro area which are related to children’s entertainment. We considered bowling alleys, zoos, sports teams, arcades, museums and theme parks as children’s entertainment establishments. Data comes from the U.S. Census Bureau’s 2015 Metro Area Business Patterns Survey.
- Median home value. Data comes from the U.S. Census Bureau’s 2015 American Community Survey.
- High graduation rate. Data comes from the U.S. Department of Education and is for the 2014 – 2015 school year.
- Percent of students proficient in language arts. Data comes from the U.S. Department of Education and is for the 2014-2015 school year.
- Percent of students proficient in math. Data comes from the U.S. Department of Education and is for the 2014-2015 school year.
- Child poverty rate. This is the percent of residents under the age of 18 who are living below the poverty level. Data comes from the U.S. Census Bureau’s 2015 American Community Survey.
- Percent of population who are children. This is the percent of population under the age of 20. Data comes from the U.S. Census Bureau’s 2015 American Community Survey.
- Median air quality index. This measures how clean the air is. Data comes from the Environmental Protection Agency.
- Absolute upward mobility. This measures how likely it is for someone born in the bottom quartile of society, in terms of income, to move up. Data comes from Harvard’s Equality of Opportunity Project.
- Water quality. This is the percentage of families who had a water quality violation. Data comes from countyhealthrankings.org and is from 2014.
- Infant mortality rate. This is the number of deaths among children less than 1 year old per 1,000 live births. Data is from countyhealthranking.com for 2015 and is measured at the county level.
- Child mortality rate. This is the number of deaths among children under age 18 per 100,000 residents. Data is from countyhealthranking.com for 2015 and is measured at the county level.
- Percent of children without health insurance. This is the percent of the population under 18 who does not have health insurance. Data is from the U.S. Census Bureau’s 2015 American Community Survey.
We began by ranking each city in the 13 metrics, giving a half weight to air quality and water quality, and a full weight to the other factors. Then we found each city’s average ranking. Next we used this average ranking to determine each city’s final score. The city with the best average ranking received a 100. The city with the lowest average ranking received a 0.
Tips for Keeping Costs Low When Raising Children
Raising a child is expensive no matter how you slice it. The United States Department of Agriculture estimates that raising the average child to the age of 17 would cost cost over $230,000. But all that spending means there is plenty of room to optimize and stretch budgets.
One budgeting tip for new parents is to think carefully about what is a need vs. what is a want. Do you really need a top-of-the-line stroller or crib? An average-priced one may suit your needs just fine. Another option is to buy used items. It is possible to find affordable, lightly used changing tables or strollers for sale at thrift shops or on websites like Craigslist. Your local community website or parenting board may even have a forum for listing used baby items. A third easy way to save on costs is to buy items you know you’ll need, like baby wipes and diapers, in bulk. Buying in bulk can cut the cost of those items in half, saving hundreds of dollars every year.
There are also ways to save while you spend. If you have a high enough credit score, you may qualify for the best rewards credit cards. These credit cards come with great perks like 2% – 5% cash back on certain categories like gas. This means you can turn driving your child to and from daycare into your next vacation.
The data analysis for this study was completed by Nick Wallace.
Questions about our study? Contact us at press@smartasset.com.
Photo credit: ©iStock.com/rawpixel