 Written by
The Department of Housing and Urban Development (HUD) recommends spending no more than 30% of your income on housing. But in some cities across the country, people are forking more than half their income over to rent, or buying homes worth 10 times their annual salary. According to HUD’s guidelines, these people are housing cost-burdened. Read on as SmartAsset takes a look at these and other affordability ratios to find the least affordable housing markets in America.
Thinking about buying? Check out current mortgage rates.
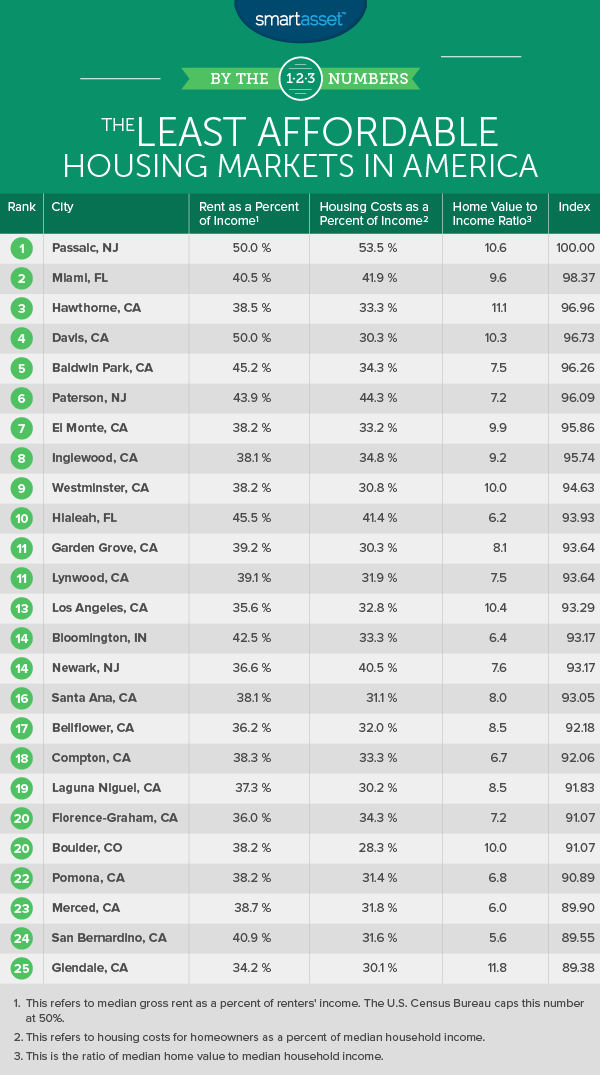
In order to find the least affordable housing markets in America, we looked at data on three different affordability ratios. We looked at rent as a percent of income, average housing costs as a percent of median household income and median home value to median household income. Taken together they cover a range of housing affordability issues. Take a look at our data and methodology section below to see how we created our scores and where we got our data.
Key Findings
- Triple trouble – Nineteen of the 20 least affordable cities in the country are located in three states: California, New Jersey and Florida. Only Bloomington, Indiana, ranked 14th, stops these three states from taking all 20 spots. California makes up the bulk of the top 20, with 14 cities, while New Jersey has three and Florida has two.
- Not just rich cities – San Francisco often grabs the headlines for its eye-popping rent numbers. Indeed the average San Francisco renter, according to the Census Bureau, is paying about $1,660 per month. But when you make $92,000 per year in household income (which the average San Francisco household makes), $1,660 doesn’t seem so bad. In this study, the least affordable cities are often places where rents have increased but incomes did not rise. In Passaic, New Jersey, for example, renters pay only $500 less than San Francisco renters. However, households in Passaic make almost $70,000 less per year than they do in San Francisco.
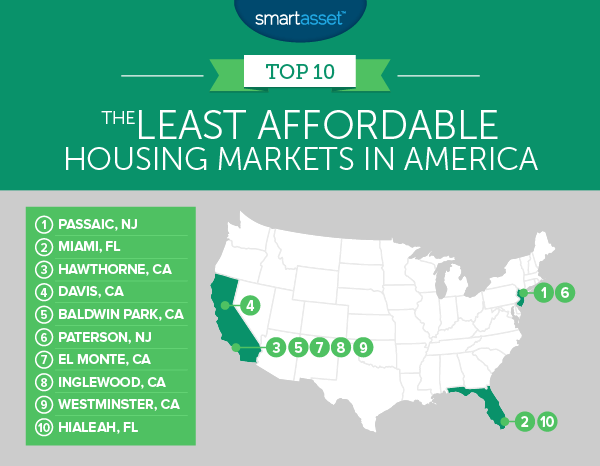
1. Passaic, New Jersey
Passaic is located just north of Newark. Our data shows that the 70,000 residents here face enormous difficulty affording housing. Renters pay over 50% of their income keeping a roof over their heads, on average. That’s the highest rate in the nation. Passaic homeowners are struggling to get by, too. Average housing costs eat up 53% of the average household’s budget. Part of the problem is that the median household income in Passaic is just under $27,000.
2. Miami, Florida
We found that, in order to comfortably afford rent on a two-bedroom apartment in Miami, you would need to make around $90,000 per year. And our data shows that the average household in Miami makes $30,000 per year. That’s one-third less than we estimate they would need. (Readers should note that the U.S. Census Bureau differentiates between Miami Beach and Miami. Residents in Miami Beach earn just under $51,000, on average.)
Data also shows that Miami homes are largely outside of the reach of Miami residents. The average home is worth 9.5 times more than what the average Miami household earns per year putting it outside the affordable range. According to some experts, homebuyers can comfortably afford homes that are two or 2.5 times their annual gross income.
3. Hawthorne, California
Residents in Hawthorne, California face the largest gulf between median annual income and home values. For average Hawthorne residents to buy the average home they would need to save 11.1 years’ worth of annual income. On other metrics, however, Hawthorne is faring better. The average renter pays about 38.5% of her income on rent, while average homeowners spend around 33% of their income on housing costs.
4. Davis, California
Davis is another city, like Passaic, where renters are paying over 50% of their incomes on rent, on average. On average Davis residents are wealthier than Passaic residents, but they also face much higher housing costs. Davis homeowners fare better than their renting counterparts. Homeowners pay only 30% of their income on housing costs, on average, which is reasonable. But buying a home may be a struggle for many Davis residents. Average home values are about 10 times higher than the average household’s income.
5. Baldwin Park, California
Folks in Baldwin Park, California pay, on average, 45% of their income on rent. That’s the sixth-highest rate in the country. The situation is a little less dire for those who own their homes. Homeowners pay only 34% of their income on housing costs, on average. But, like in Davis, it may be difficult for the average Baldwin Park resident to become a homeowner. The average Baldwin Park home is worth more than 7.5 times the average income.
6. Paterson, New Jersey
Paterson renters spend just under 44% of their income on rent, on average. That figure is way above the generally recommended figure of 30%. Rents in Paterson in 2015 were almost identical to what they were in 2011: $1,079 and $1,075, respectively. Unfortunately, over that same time period, average household incomes dropped, from $32,400 per year to $31,500 per year, worsening the housing cost burden for residents.
7. El Monte, California
El Monte is a fairly large city in Los Angeles County. Renters here typically spend just under 39% of their income on rent. Homeowners spend less, around 33% of their income on rent, on average.
But like other cities in our top 10, it may be difficult for El Monte residents to comfortably afford to buy a home. The average home is worth just under 10 times more than the average annual income. One positive, however, is that California mortgage rates are lower than the U.S. average making this a good time to get a mortgage.
8. Inglewood, California
Inglewood is another city in Los Angeles County and comes in as the eighth-least affordable housing market in the country. According to U.S. Census Bureau data, the average Inglewood renter pays over 38% of his income in rent. That does not leave a ton of extra room for saving up for a down payment, meaning it may be hard for renters to buy one day. The average home in Inglewood is worth about nine times more than the average household income.
9. Westminster, California
Westminster is a city of about 91,000 residents, the majority of whom are housing cost-burdened. The average homeowner pays about $1,420 in housing costs, according to Census Bureau, while only earning around $55,000. This means they are forking over 30% of their income just to keep a roof over their heads.
A big issue in Westminster is the inability of the average resident to responsibly afford homes. The average home costs just under 10 times more than the average households earns each year.
10. Hialeah, Florida
Renters and homeowners in Hialeah, Florida are both in a pinch. On average, renters pay over 45% of their income in rent, and non-renters pay over 41% of their income in monthly housing costs. But in one sense Hialeah is unique in its unaffordability. While both of those numbers are alarming, Hialeah actually has the lowest median home value to household income ratio in our top 10.
Data and Methodology
In order to find the least affordable cities in America, SmartAsset looked at housing data for 584 American cities. We collected data on the following three factors:
- Rent as a percent of income. This is the percent of income which renters pay on rent. For this metric, the Census caps the number at 50%. In cities where renters pay more than 50% of their income on rent, the Census writes 50+. In cases like this we used 50% as our metric. Data comes from the Census Bureau’s 2015 1-Year American Community Survey.
- Housing cost as a percent of income. This is the percent of income going to rent. We used median housing costs and median household income to find this statistic. Data comes from the Census Bureau’s 2015 1-Year American Community Survey.
- Ratio of median home value to median household income. Median household income and median home value come from the Census Bureau’s 2015 1-Year American Community Survey.
We then ranked each city in each metric, giving an equal weighting to each metric. After ranking, we found each city’s average ranking. We used this average ranking to create our final score. The city with the best average ranking received a 100. The city with the worst average ranking received a 0.
Questions about our study? Contact us at press@smartasset.com
Photo credit: ©iStock.com/SelectStock