 Written by
Education is a factor that parents often take into account when deciding where to settle down and purchase a home. That’s why most of the best places to raise a family have good schools. While education has never been the great equalizer it was meant to be for students in the United States, those who receive a high quality public school education have a greater chance of graduating from college and succeeding in the real world.
Looking to move to a state with great schools? Check out the current mortgage rates.
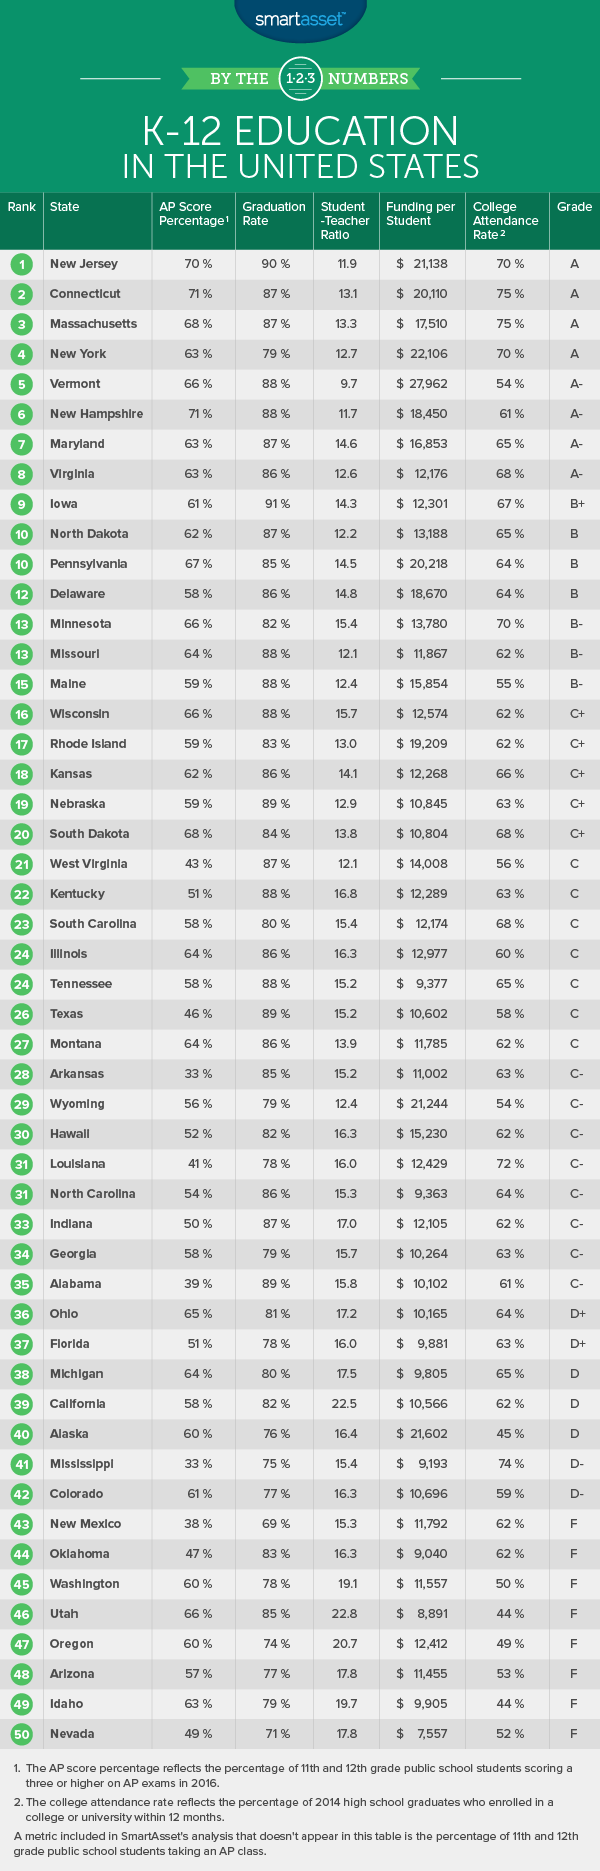
The U.S. high school graduation rate recently reached an all-time high of 83%. But school performance and academic achievement vary widely from district to district and state to state. Student-teacher ratios range from 9.7 to 1 in Vermont to 22.8 to 1 in Utah. And in several states, less than half of high school graduates start college within a year of earning their diplomas.
Study Specifics
SmartAsset wanted to assess the quality of K-12 education in each state. So we collected data on public schools and ranked all 50 states using six different metrics, including the college attendance rate, the graduation rate and the student-teacher ratio.
Our study also looks at K-12 funding per student, the percentage of upperclassmen taking AP classes and the percentage of students scoring a three or higher on their AP exams. For a detailed look at how we conducted our analysis, read the data and methodology section below.
This is SmartAsset’s third annual study of the states with the best schools. Read the 2016 study here.
Key Findings
- New Jersey is No.1. New Jersey was one of the top states for K-12 education in the 2015 and 2016 editions of our analysis. But this year, it ranks as the state with the best public education system.
- Nevada is No. 50. For the third year in a row, the Silver State takes the last spot on our list. Its student-teacher ratio is high (17.8 to 1) and its four-year high school graduation rate is just 71%.
- Northeastern schools still get high marks. As we’ve seen in the past few years, most of the states with the best public schools are located in this region. In each of these states, funding per student and four-year high school graduation rates are higher than average.
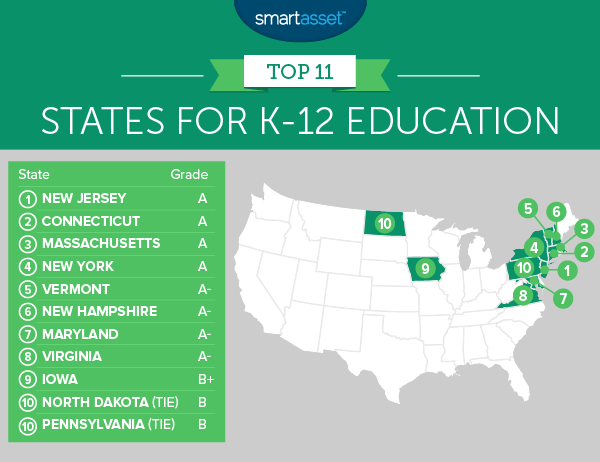
1. New Jersey
There are many reasons why New Jersey earns an A for its K-12 public education system. Its high school graduation rate is the second-highest rate in the country (90%). It also has a low student-teacher ratio (11.9 to 1) and a high college attendance rate (70%). About 70% of 11th- and 12th-grade students scored a three or higher on their AP exams in 2016. That’s a strong indication that many public school students in New Jersey are prepared to start college after they graduate.
Something else that New Jersey is known for is its high property taxes. The average effective property tax rate in the Garden State is 2.19%, which is much higher than the national average. That gives the state the chance to allocate a significant portion of its funds to education. Funding per student was $21,138 during the 2014-2015 school year. That’s the fifth-highest amount of per-pupil public school funding in the nation.
2. Connecticut
Connecticut ranked as the top state for public education in the 2015 and 2016 editions of our analysis. But this year it slipped to the No. 2 spot on our list. Just as we found in last year’s analysis, 87% of public high school students in Connecticut graduate within four years.
Although it has fallen in the rankings since last year, the Constitution State ranks first for its college attendance rate (along with Massachusetts). About 75% of students who graduated from high school in 2014 enrolled in a college or university within a year.
3. Massachusetts
Five-year estimates from the Census Bureau’s 2015 American Community Survey report that the median household income in Massachusetts is around $68,563. That’s about 24% higher than the national average ($53,889). Wealthier communities tend to have well-funded schools with more resources than schools in poorer areas. And sometimes when it comes to academic achievement, more money translates to better results. That’s certainly the case in Massachusetts where the high school graduation rate is 87%.
4. New York
New York is another state that consistently rates well for its K-12 public education system. It spends more money on public education than any other state in the nation, except for Vermont. It also has the 10th-lowest student-teacher ratio (12.7 to 1) and the eighth-highest percentage of high school students taking at least one advanced placement class.
Something that New York state could improve on is its high school graduation rate. The Empire State had one of the lowest public high school graduation rates during the 2014-2015 school year (79%).
5. Vermont
Nationwide, the average public school revenue per student enrolled during the 2014-2015 school year was $12,578, according to the National Education Association (NEA). Funding per student in Vermont is more than twice the national average ($27,962). In fact, the Green Mountain State spends more on public school education than any other state in the country. Vermont also ranks first for its low student-teacher ratio. Data from the NEA reveals that there are fewer than 10 students for every K-12 public school teacher.
6. New Hampshire
School districts in New Hampshire are required to report the number of students participating in the advanced placement program to the Department of Education each year. Making information about AP classes publicly available is supposed to hold schools accountable for providing rigorous courses that prepare students for college. And so far that policy seems to be working. The number of 11th- and 12th-grade public school students taking AP courses is now 28%, up from 25% in 2015.
Most public school students in New Hampshire (71%) scored a three or higher on their AP exams in 2016. This means that many of the state’s students start college with credits under their belts.
7. Maryland
The state of Maryland had the highest percentage of public school students enrolled in an AP class in 2016. According to the College Board, about 57% of 11th- and 12th-grade students took a class that would give them the opportunity to earn college credit before they left high school. And 63% of public school students in Maryland scored a three or higher on their AP exams. Knocking out some course requirements before starting college can lower the cost of higher education and save students money.
8. Virginia
Virginia ranks as the eighth-best state for K-12 education. One school in Alexandria – the Thomas Jefferson High School for Science and Technology – was recently recognized as one of the best high schools in the country in a ranking by U.S. News & World Report. Statewide, public schools in Virginia rate well for having a high percentage of students enrolled in AP classes (44%) and a relatively low student-teacher ratio (12.6 to 1).
9. Iowa
Iowa has the highest high school graduation rate in the country. Data from the National Center for Education Statistics indicates that 91% of its public high-school students graduate within four years. About 67% of high school graduates in 2014 went on to attend college within 12 months of receiving their high school diplomas. Its high college attendance rate is one reason why Iowa also ranks as one of the best states for higher education.
10. (tie) North Dakota
North Dakota falls to the 10th spot on our list, down from fifth place in last year’s analysis. Funding per student grew by 2.29% within a year. The state now invests around $13,188 in each of its public school students. But so far that hasn’t paid off yet. The percentage of high school students attending college within a year of graduation fell by one percentage point. And the percentage of students scoring a three or higher on their AP exams fell by five percentage points to 62%. Compared to most states across the country, however, North Dakota still provides its public school students with a high quality education.
10. (tie) Pennsylvania
Data from the National Education Association reveals that public school funding per student in Pennsylvania was around $20,218 during the 2014-2015 school year. But per pupil funding varies widely throughout the state and some of the poorest households pay the most property taxes. Funding inequity has become such a hot button issue that Pennsylvania legislators are considering whether they should eliminate school property taxes altogether.
While more work needs to be done to ensure that there’s equal opportunity in public education, the Keystone State still ranks well in our analysis. Its AP score percentage (the percentage of 11th- and 12th-grade students who scored a three or higher on exams in 2016) is the sixth-highest in the country.
Data & Methodology
To find the states with the best schools, SmartAsset ranked all 50 states using most of the metrics that we considered in the 2016 edition of our study. The ACT stopped publishing state-level testing data on its website. So we excluded the metric reflecting the percentage of students taking the ACT or SAT. In the end, we used the following factors to evaluate the quality of K-12 education in each state:
- Student-teacher ratio. This factor shows the number of students enrolled per teacher in public K-12 schools as of 2014. The data comes from the National Education Association’s 2016 Rankings & Estimates report.
- Funding per student. This metric looks at the public school revenue per student enrolled for the 2014-2015 school year. The data comes from the National Education Association’s 2016 Rankings & Estimates report.
- Graduation rate. This is the 2014-2015 public high school four-year graduation rate. The data comes from the National Center for Education Statistics.
- College attendance rate. This metric looks at the percentage of 2014 high school graduates who enrolled in a college or university within 12 months. College attendance data comes from the National Center for Education Statistics and high school graduation data comes from the Western Interstate Commission for Higher Education (WICHE).
- Percentage of students taking an advanced placement (AP) class. This metric looks at the number of public school students enrolled in an AP class in 2016 as a percentage of 11th- and 12th-grade enrollment. This data comes from the College Board.
- Percentage of students scoring a three or higher on AP exams in 2016. Generally, a three is the minimum AP score needed to be eligible for college credit. This data also comes from the College Board.
In order to complete or analysis, we ranked all 50 states across all six of our factors. Then, we averaged our rankings, giving half weight to the two measures of AP testing and full weight to the other four factors. Finally, we gave each state a grade based on those average rankings. The states that ranked in the top 15% received either an A or an A-. The states that ranked in the bottom 15% received an F.
Nick Wallace completed the data analysis for this study.
Questions about our study? Contact us at press@smartasset.com.
Photo credit: ©iStock.com/monkeybusinessimages