 Written by
Editor’s Note: This study was originally published in July 2019.
When buying a home, there are a lot of considerations to weigh. One of them is how the value of your home is likely to change in the years you own it. This involves two major factors – growth and stability. Growth is a measure of how much the value of your home is likely to go up over the years. A home that grows in value can present a tidy payday for you in the event you decide to move. The other is stability, which measures how likely it is that your home will take a major dip in value. A fall in the value of your home can leave you underwater on your mortgage, which is a position no one wants to be in.
SmartAsset collected and analyzed home values to find the metro areas that are the best bets for growth and stability based on historical data. Specifically, we compared home value data for every quarter during the 25-year period from the first quarter of 1994 up to and including the fourth quarter of 2018. For details on our data sources and how we put all the information together to create our final rankings, see the Data and Methodology section below.
Key Findings
- Colorado and Texas dominate the top 10. Colorado had three metro areas placing in the top 10 and two metro areas placing in the top five, including the No. 1 metro area, Boulder. Texas also did well, with three metro areas reaching the top 10 and two making the top five. Additionally, California metro areas earned two spots in the top 10.
- Stability stays the course. Seven of the metro areas that cracked our 2018 top 10 also make it into our 2019 top 10. Billings, Montana; Grand Forks, North Dakota-Minnesota and Casper, Wyoming dropped this year to 12th, 15th and 27th respectively from 8th, 7th and 6th last year. San Francisco and San Jose, California rose this year to tie at 6th this year from 13th and 15th last year, respectively. A stable housing market requires years of consistent performance, so it’s not unusual that places repeat year after year.
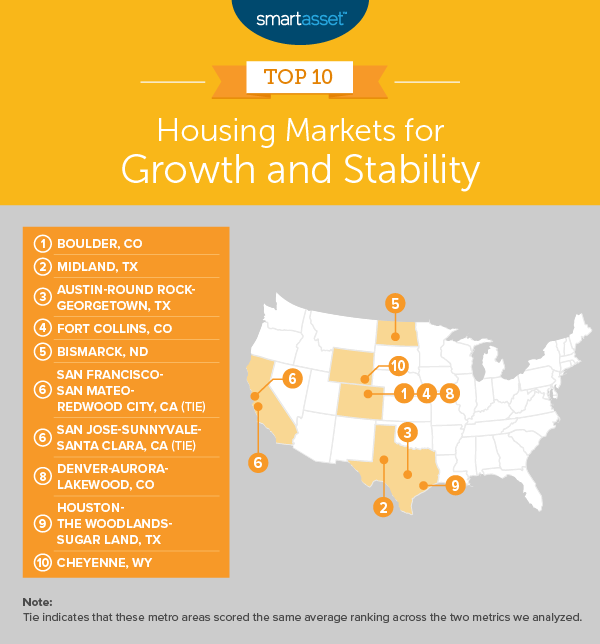
- Boulder, CO
Leading this study for the fifth year in a row is Boulder, Colorado. Besides being a great place for career opportunities, Boulder has shown consistently strong performance in the housing market. It has seen a 268% increase in housing value from the first quarter of 1994 up to and including the fourth quarter of 2018, the fourth-highest percentage of any metro area in our top 10, and fifth-highest in our study overall. The average homeowner didn’t experience significant drops in value within ten years of purchase. For those looking to invest in real estate, Boulder is a safe bet and is in one of the best states in the country for homeowners.
- Midland, TX
Placing second, Midland, Texas has seen average home values grow 256% in the 25 years since 1994. The probability that Midland homeowners lost at least 5% of value within ten years of purchase was particularly low. This could be a contributor to the fact that Midland is one of the top 10 rising housing markets in the country.
- Austin-Round Rock-Georgetown, TX
The Austin-Round Rock-Georgetown, Texas metro area ranks third in our study of the best housing markets for growth and stability. Home values in the area have grown by 242% from 1994 through 2018, with exceptionally low volatility. Round Rock, Texas is also one of our 2019 best cities for living the American Dream.
- Fort Collins, CO
Fort Collins is Colorado’s second entry and ranks fourth in our study overall. There has been growth of 245% in home values from the first quarter of 1994 through the fourth quarter of 2018. Based on historical data, Fort Collins homeowners had just a 2% chance of seeing a significant decline in their home’s value by at least 5% within 10 years of purchase.
- Bismarck, ND
Bismarck, North Dakota is the fifth best housing market for growth and stability in our study this year. Bismarck has seen 204% growth in home values in the 25 years since the first quarter of 1994. Homeowners here enjoyed little chance of seeing their home decrease in value by 5% or more within 10 years after their purchase. If you’re thinking of buying in this metro area, be sure to take into account your other finances in order to understand how much house you can afford.
- San Francisco-San Mateo-Redwood, CA (tie)
The San Francisco, California metro area ranks sixth in our study and is the first of two metro areas in the top 10 that are located in Northern California. This area has the highest growth of any metro area in this study, a 375% increase in home value in the 25 years from the first quarter of 1994 through the fourth quarter of 2018. The stability, though, has not been as strong relative to several of the other locations in our top 10. We estimate there was a 19% chance that a home decreased in value by at least 5% within 10 years of being bought.
- San Jose-Sunnyvale-Santa Clara, CA (tie)
San Jose, California is the second Golden State metro area on the list and ties with San Francisco for sixth place. Incidentally, these two areas are also the places where Americans spend the most on housing. The San Jose area has the second-highest growth rate for home values overall, at 357%. It does have some volatility, though. According to our data, there was a 19% chance that homeowners will see a decrease of at least 5% in the value of their property within 10 years of purchasing it.
- Denver-Aurora-Lakewood, CO
The Denver-Aurora-Lakewood, Colorado metro area moves up one spot from last year. According to our data, the average home here has grown 279% in value over the 25 years from 1994 through 2018. That’s the third-highest rate in our top 10, as well as the third-highest rate out of all 358 metro areas in the entire study. However, homeowners here had an estimated 17% chance of seeing their home decrease at least 5% in value within the first 10 years of purchase. If you decide to buy a house in the Denver area, consider taking stock of how your other investments might grow over time.
- Houston-The Woodlands-Sugar Land, TX
Houston-The Woodlands-Sugar Land, Texas is the second-to-last-metro area in our top 10, moving up from No. 14 in our 2018 study. Home values here grew 174% in the 25 years from 1994 through 2018, which is the second-lowest rate for this metric in the top 10 but which still ranks in the top 20% of the study overall. Stability here remained exceptionally high, however.
- Cheyenne, WY
Cheyenne, Wyoming maintained its No. 10 spot from last year. This area has seen home values grow by 170% in the 25 years from the first quarter of 1994 through the fourth quarter of 2018, with little volatility. These are definitely options to consider if you’re weighing your options between renting and buying.
Data and Methodology
To create our rankings of the best housing markets for growth and stability, we looked at data for 358 metro areas. Specifically, we compared all of the areas across the following two metrics:
- Stability. This is the probability that homeowners experienced a significant price decline (5% or more) at any point within the 10 years after they purchased the home, for the subject time period.
- Overall home price growth. The total growth in home prices during the subject time period.
We indexed then averaged the two metrics to create our final ranking. All data comes from the Federal Housing Administration (FHA). It covers the period between the first quarter of 1994 and the fourth quarter of 2018.
Tips for Homeownership
- House hunt help. Trying to find a house to buy? Consider getting some help from an experienced advisor. Finding the right financial advisor that fits your needs doesn’t have to be hard. SmartAsset’s free tool matches you with financial advisors in your area in 5 minutes. If you’re ready to be matched with local advisors that will help you achieve your financial goals, get started now.
- Mortgage management. Knowing what you’ll be paying each month is key to planning how homeownership will fit into your life. Use SmartAsset’s free mortgage calculator to get a sense of what your monthly payment will look like.
Questions about our study? Contact press@smartasset.com
Photo credit: ©iStock.com/sturti