 Written by
According to the Texas A&M Transportation Institute, the average auto commuter in the United States spends 42 hours per year in traffic. That same study puts the price tag of those delays at $960 per driver. In big cities, the numbers are even uglier. Drivers in the 15 largest U.S. metro areas spend an average of 63 hours per year stuck in congestion on the way to work, costing an average of $1,433 per person.
Compare car commutes and transit commutes in any U.S. city with SmartAsset’s commute calculator.
Nobody likes sitting in traffic and it’s reasonable to assume that if these drivers had a better alternative, they might willingly hop on board. In theory, that alternative is public transportation – buses, commuter trains, light rail, street cars and subway systems. At its best, public transportation is as reliable as driving, more efficient, less stressful and cheaper. Most American cities fall well short of that ideal, however. Most – but not all. And if public transportation isn’t an option for you, consider a cash back credit card that rewards you for all the gas you buy or check your budget for ways to save in other areas.
Data & Methodology
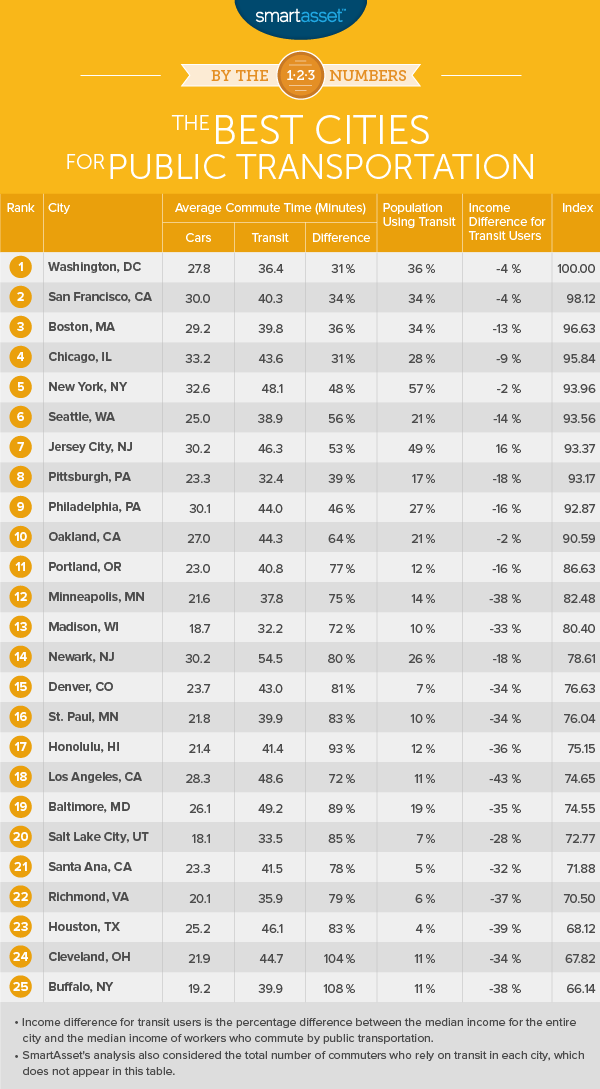
To find cities with the best transit systems in 2016, SmartAsset looked at U.S. Census Bureau data on the use of public transportation in every U.S. city with a population of more than 175,000 people (136 cities total). We considered the following five metrics in particular:
- The average commute time for transit users.
- Percentage difference between average commute times of car commuters and transit users.
- Percentage of commuters who use public transit.
- Total number of commuters who use public transit.
- The difference between the citywide median income and the median income of transit users.
The first two metrics reflect the efficiency of each city’s transit system. Shorter commute times for transit users reflect a more efficient system. Likewise, if driving is significantly faster than transit, the system is not offering an attractive alternative on practical or economic grounds.
Moving to a new city? Try SmartAsset’s free mortgage calculator to see what your house payments will be.
The third and fourth metrics reflect the availability of transit. More people using public transit indicates a system with greater coverage and more capacity. The fifth metric reflects the overall quality of the system. In many systems, transit serves as a citywide backup plan. It is used primarily by people who cannot afford to own a car or to drive. A smaller income gap reflects a system that provides an attractive option for all commuters.
We ranked each city in our analysis according to those five metrics. We then averaged those rankings, giving half-weight to the total commute time for transit users and full weight to the other four metrics. Lastly, we calculated a score based on that average. The city with the best overall average ranking scored a perfect 100, with lower scores corresponding to lower average rankings.
All data used in this analysis comes from the U.S. Census Bureau’s 2014 American Communities Survey. Ridership figures cited below come from transportation authority websites and the American Public Transportation Association’s Ridership Report.
Find out now: How much money could I save by buying a home?
Key Findings
- Transit is gaining steam. The total number of transit users was up 9% from 2011 in the 136 cities in SmartAsset’s analysis. In major cities in the west and in Texas, including San Jose, Dallas, Seattle and Denver, transit use increased by more than 20%.
- Slow trains in the south. Houston rates as the only southern city with a top-25 transit system. In many major southern cities, including Charlotte and Atlanta, the typical transit commute length is double the commute length for drivers.
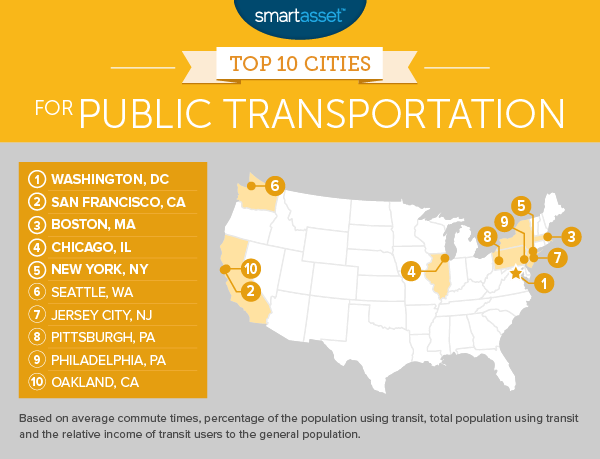
1. Washington, D.C.
The Washington Metropolitan Area Transit Authority manages public transportation throughout the DC area, primarily relying on buses and below-ground subways. The subway system, known as Metro or Metrorail, handles over 200 million trips per year, making it the second largest system by ridership in the U.S. That is in addition to a bus system that handles another 130 million trips every year.
It isn’t just size that makes D.C.’s transit system the best in the U.S. The typical transit commuter in D.C. spends 36 minutes traveling to work each day. That is 10 minutes below the average for the 136 cities in SmartAsset’s study. It is also just 8.6 minutes slower than the typical commute time for a driver in the District, the smallest difference among cities in which a significant percentage of the population relies on transit.
One drawback to the public transportation in D.C. is the cost. The District has some of the highest fares for transit of any U.S. city, with a monthly pass costing more than $230.
2. San Francisco, California
San Francisco is home to perhaps the nation’s most recognizable mass transit icon: the historic cable cars that run up and down the city’s steep hills. While just 3 of the original 23 cable car lines remain, and while the vast majority of cable car users today are tourists, they serve as a reminder of the role transit has played in the development of San Francisco and the Bay Area.
Today, buses and commuter trains constitute the most significant pieces of San Francisco’s transit system. Bay Area Rapid Transit (BART) moves commuters to and from nearby cities such as Oakland and Berkeley. Muni (San Francisco Municipal Railway) operates a system of buses and light rail trains (along with the aforementioned cable cars) that handles over 220 million passenger rides every year.
3. Boston, Massachusetts
The Massachusetts Bay Transportation Authority (MBTA) handles all public transportation in Boston. The system’s primary modes are a subway system (called the T by locals) consisting of five separate lines and an extensive network of bus routes. Overall, it handles about 390 million rides per year. The percentage of commuters that primarily use transit to get to work in Boston is 34%, fifth highest in the U.S.
4. Chicago, Illinois
Chicago’s transit system is among the oldest in the U.S. It has been in operation since 1892, when the South Side Rapid Transit began operation. Today, Chicago’s “L” trains form the third-largest city rail system in the U.S., handling an average weekday ridership of nearly 800,000.
The typical transit commuter in Chicago spends 43.6 minutes getting to work each day, which is just 10 minutes more than the average car commuter in the Windy City. That is the seventh-lowest difference of the 136 cities in SmartAsset’s analysis. Furthermore, at about $100 per month, transit passes in Chicago are cheaper than in other top cities like New York and DC.
5. New York, New York
Based on sheer size, there is no question that New York City has the top public transportation system in the U.S. It moves by far the largest number of passengers, with subway ridership of more than 1.7 billion in 2014. When including buses, total ridership is more than 2.5 billion.
Are you taking advantage of all your commuter tax breaks?
Size, however, is not everything. The average commute time for transit users in New York is 48 minutes, which ranks 81st out of the 136 cities in SmartAsset analysis. Although drivers in New York don’t exactly have it easy, transit users have it worse, with an average commute that is 48% longer than the average for car commuters.
6. Seattle, Washington
The city of Seattle has been growing rapidly in recent years and traffic in the area has gone from bad to worse. For Seattle commuters caught up in congestion, however, transit offers reason for hope.
The region’s transit agency (Sound Transit) recently completed an underground light rail line several months ahead of schedule, which will connect downtown Seattle to the University of Washington (located in north Seattle) when it opens later this year. The city also opened a brand new street car line earlier this year, Seattle’s second streetcar line.
These and earlier investments are already paying dividends in the form of more riders. The number of Seattleites relying on public transit to get to work is up 34.9% since 2011. The percentage of Seattle commuters using transit is up 3.8%. That’s the largest increase of any major U.S. city.
7. Jersey City, New Jersey
Located across the Hudson River from Manhattan, Jersey City is one of just a handful of cities in which transit users have a higher median income than car commuters. For those who commute to New York from Jersey City, transit can be far more convenient than driving as there are trains and ferries that go directly to Manhattan.
8. Pittsburgh, Pennsylvania
According to the U.S. Census Bureau, public transportation commuters in Pittsburgh spend an average of 32 minutes traveling to work, the 11th-fastest transit commute time of the 136 cities in our analysis. That is also just nine minutes slower that the average commute time for drivers, the fifth-smallest difference.
The majority of transit riders in Pittsburgh use buses. Bus trips account for about 180,000 of 214,000 riders on a typical weekday. Light rail (known as “the T”), which runs underground in downtown Pittsburgh and above ground in outlying areas, accounts for about 28,000 rides per day.
9. Philadelphia, Pennsylvania
Roughly 171,000 workers in the city of Philadelphia use public transportation, the fourth largest number of any U.S. city (note: that figure does not include those who travel from outside the city into Philadelphia). The system combines underground subways, street-level trolleys, trolley buses, regular buses and commuter rails. The various types of trains account for more than 290,000 rides on a typical weekday, while buses and trolley buses move about 490,000.
10. Oakland, California
Thanks in part to its (relatively) affordable housing market, Oakland has become an increasingly popular place to live for people who commute to San Francisco. This shift may account for changing patterns in its public transportation usage.
Today, some 21% of the population uses public transportation to get to work. That’s up 1.5% since 2011, the 11th highest rise of any major U.S. city. Oakland also has one of the nation’s smallest income gaps between transit commuters and car commuters. The median income for the former is just 2% lower than the median income for the latter.
Questions about our study? Contact us at blog@smartasset.com.
Photo credit: ©iStock.com/Shakzu