 Written by
A cup-and-handle pattern is the name of a chart pattern used in technical analysis that describes a bullish continuation trend in the price of a security, typically a stock. Traders sometimes use this pattern as a signal about when to buy the stock. As with all forms of technical analysis, this pattern essentially tracks investor behavior, not the underlying strength or weakness of a company’s business. Here’s what it is, how to use it and a caution. Consider working with a financial advisor as you analyze possisble stock purchases.
What Is the Cup-and-Handle Pattern?
In the cup-and-handle pattern, a stock’s price will follow five movements:
- Firstly, the price of a previously growing asset will decline until it hits a stable low point.
- Secondly, the price of the asset will stay at this stable point for a period of time.
- Thirdly, the price of the asset will then recover to approximately its original value. This creates a “U” shape on the trading chart, the “cup” after which this pattern is named.
- Fourthly, the price of the asset stabilizes for a period of time. This is the “handle” of the pattern. In this phase the asset’s price will often decrease by a limited amount, but no more than a third of the cup’s earlier decline. If the second decrease resembles the first set of losses this is not a cup-and-handle and may represent a long-term decline in value.
- Finally, the price of the asset resumes its growth.
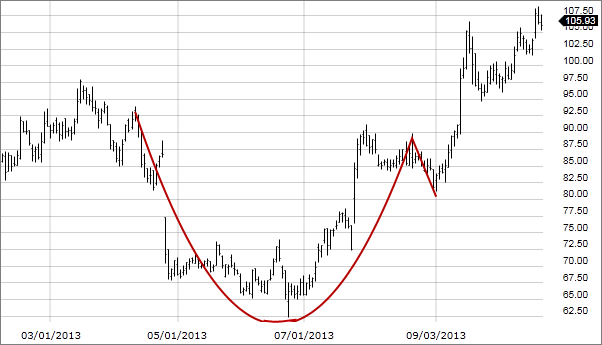
A cup-and-handle pattern, illustrated below, is considered a bullish trading trend. It represents a consolidation period for a strong asset, during which traders move away from a stock, which is generally growing well. After this short-term consolidation the stock recovers its lost value and resumes its previous growth.
The pattern is partially defined by this final return to growth. If the cup is followed by long-term stability in the asset’s price, then this is considered a revaluation or momentary dip rather than a trading pattern. The cup-and-handle is defined by the short-term dip in an otherwise long-term pattern of growth.
A cup-and-handle pattern can take place over any period of time. Some patterns emerge during day trading, forming over the course of hours, while others can take shape over the better part of a year. Often the asset’s price will remain at its low point for weeks or even months before recovering its value.
Trading the Cup-and-Handle Pattern
Historically speaking, when a stock’s price forms a handle after emerging from a cup, this means that investors are likely to begin buying back in soon. In terms of investor behavior, this pattern represents a few stages of thought:
- First, the downturn indicates investors moving off of a stock that had been growing, often for fear of an overvalued asset or to book gains.
- The rally indicated by the cup shape shows re-investment in an asset that had become undervalued.
- The handle indicates a pause in re-investment. Once the cup regains its high there’s a modest pullback as investors consolidate rather than invest. This is often driven by sales from investors who bought during the low point and are offloading this asset now that it has returned to its previous high.
As a result of this behavior, investors generally see the handle as the place in which to buy. A stock’s price will dip while it is in the handle, but in a true cup-and-handle pattern this dip will not endure. It typically represents technical analysis rather than a shift in the stock’s fundamental value. As a result, once this post-recovery trading has finished an investor can expect the stock to resume its previous growth.
The following chart, courtesy of StockCharts.com, illustrates the pattern.
Cautions About the Cup-and-Handle Pattern
To use the cup-and-handle pattern successfully, investors must wait for the handle to form. In other words, trading off this pattern requires patience and a rational approach to the market – something that is a challenge for many investors. Once a stock has completed its recovery and begun to stabilize or turn down slightly, the pattern is almost complete. At this point investors expect it to remain stable for a period of time before resuming its previous growth. This means that the handle of a cup and handle is considered a strong indication that the stock is poised for growth.
However, a share price declines it can mean many things, not just the formation of a handle. There’s no good way to distinguish falling asset prices from the first stage of a stock which will make an eventual rally. Lucky investors who get in at the bottom of the cup will, to be sure, make more than those who invest during the handle, but just as often they may predict recoveries that never come.
Another caveat: Since the cup-and-handle pattern is widely used as the basis for trading, it may also become a self-fulfilling prophecy. The growth that a stock experiences once it enters the handle may reflect the expectations of stock traders more than any actual value on the part of the underlying company. Many stocks recover from a U-shaped dip only to then return to a long-term stability. Others may just experience what’s sometimes called a dead cat bounce or a brief period of post-low trading. In short, cup-and-handle is a pattern, not a prediction.
The Bottom Line

The cup-and-handle pattern is a stock trading pattern in which a share will lose value, only to regain it, briefly stabilize or even slightly decline before resuming growth. It can be used to spot shares potentially poised for growth if correctly identified and also caught in time. The cup-and-handle pattern can be a useful part of an overall trading strategy, but it should be just one part – albeit a relatively risky part – of a trading strategy.
Investing Tips
- No amount of analysis can make up for the advanced training of a financial advisor. If you don’t have a financial advisor yet, finding one doesn’t have to be hard. SmartAsset’s free tool matches you with up to three vetted financial advisors who serve your area, and you can interview your advisor matches at no cost to decide which one is right for you. If you’re ready to find an advisor who can help you achieve your financial goals, get started now
- Trading the cup-and-handle pattern is one technique that stems from what is known as technical analysis. But the main alternative to this type of analysis is fundamental analysis. It focuses on how the company is doing financially and operationally and can complement the insights of technical analysis.
Photo credit: ©iStock.com/MicroStockHub, ©iStock.com/Artem Peretiatko, ©iStock.com/g-stockstudio