 Written by
About three in four Americans receive a tax refund each year, and the average amount returned with those refunds is around $3,000, according to IRS data. This means that for many Americans, their tax refund is the largest single check they will receive all year, substantially affecting the trajectory of how they use or save their money before the next tax day. Though often anxiously awaited, tax refunds come with a major cost.
In this study, we looked at some of the national and state trends in tax refunds over the past five years along with what you lose by waiting for a tax refund. For details on our data sources and how we put all the information together to create our findings, see the Data and Methodology section below.
Key Findings
- The frequency of refunds has decreased. While the number of filers who received a refund grew by 1.7 million from 2013 to 2017, the total number of filers grew by 5.9 million simultaneously. As a result, the percentage of filers who received a tax refund dropped from 76.3% in 2013 to 74.4% in 2017.
- A wide range in average refunds across states. Across all 50 states and the District of Columbia, the range of the average tax refund over the past five years is greater than $1,200. The five-year average tax refund is more than 50% higher in the state with the highest average refund, Connecticut ($3,656), than it is in the state with the lowest average refund, Maine ($2,414).
- Adjusting your withholdings to avoid a refund can pay off financially. Many Americans who receive a refund have unnecessarily overpaid the government throughout the year, time in which they could have invested the money or paid down debt. We find that individuals with debt, specifically credit card debt, may lose the most money waiting for a refund. According to our estimates, someone with credit card debt who receives a tax refund of $3,000 costs himself more than $350 by overpaying on taxes and accruing interest on debt.
National Trends
Americans are getting smarter about paying their taxes more accurately throughout the year, rather than overpaying and waiting for refunds at tax time. Between 2013 and 2017, IRS data shows that the total amount refunded to Americans nationwide fell by about $2 billion. As noted in our first key finding, the percentage of tax returns with refunds has also steadily decreased over the past five years, along with the total amount refunded. All told, 76.3% of Americans filing in 2013 received a tax refund while 74.4% of Americans had refunds in 2017 – a decrease of 1.9%.
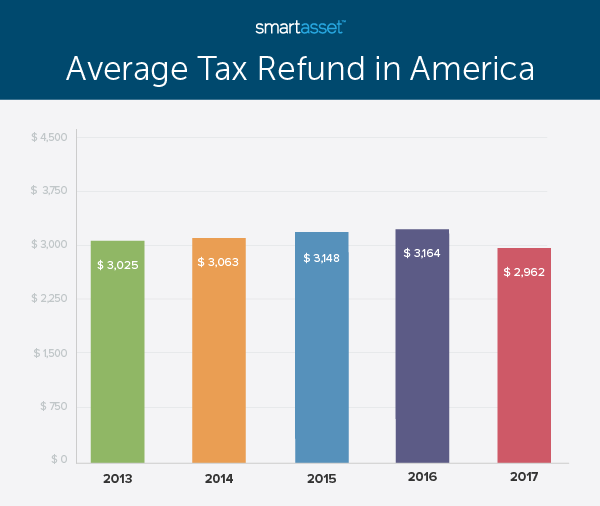
We found the average tax refund by dividing the total amount of money issued in refunds by the total number of refunds issued. Though the number of overpayments that resulted in a tax refund increased, the total number of returns did as well. Furthermore, the total amount of money issued in refunds decreased over time. While the average tax refund increased slightly each year from 2013 to 2016, it dropped in 2017 to a lower amount than it was five years prior. In 2013, the average tax refund for an American who overpaid on taxes throughout the year was about $3,025 while in 2017, it was roughly $2,962. The chart below shows the average national tax refund in each year from 2013 through 2017.
State Trends
The average tax refund varies by state. Over the past five years, Connecticut has had the highest average tax refund, at almost $3,700. The next four states with the highest average tax refund between 2013 and 2017 are Wyoming ($3,627), New York ($3,610), Texas ($3,449) and Florida ($3,310). Though Wyoming, Texas and Florida are three of the seven total states with no income tax, Connecticut and New York have among the highest income tax rates. The marginal state tax rates on income in Connecticut range from 3% to almost 7% and in New York range from 4% to 8.8%. In Connecticut, the highest rate applies to incomes greater than $500,000 while the threshold is $1,077,550 in New York.
The 10 states with the lowest average tax refund are all in the Midwest and West. Wisconsin, Minnesota, Ohio and Iowa have the third-, seventh-, eighth- and ninth-lowest average tax refunds, respectively, between 2013 and 2017. The Western states of Montana, Oregon and Idaho also have low average refunds. Over the five-year period we analyzed, the average refund in all three states was about $2,500.
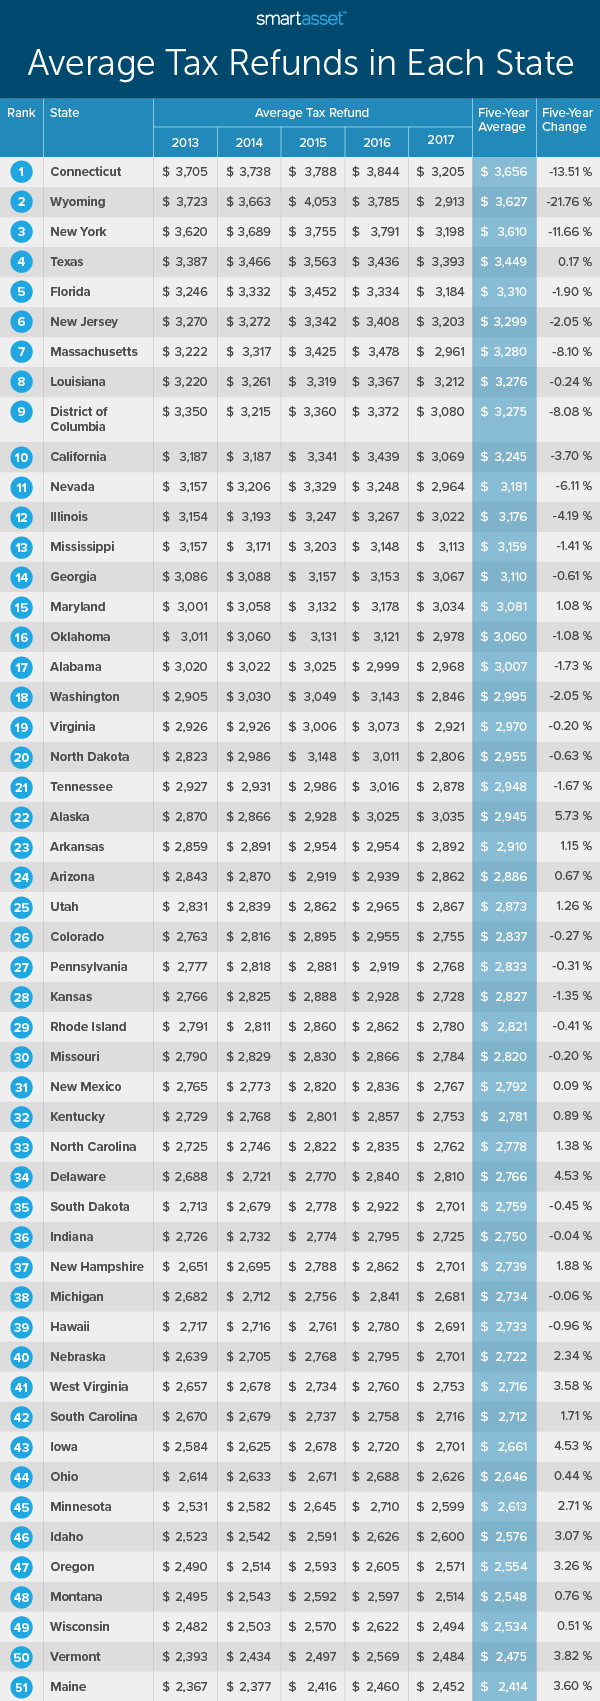
The average tax refund has not decreased uniformly across states. In fact, between 2013 and 2017, the average tax refund increased in 23 states. Alaska and Delaware saw the largest percentage increases, with the average tax refund for filers rising by 5.73% and 4.53%, respectively. In Alaska, the total amount refunded remained consistent across years, hovering around $760 million, but with 15,000 fewer taxpayers there receiving refunds in 2017 than in 2013, the average refund among per return increased over time. However, the number of Alaskan taxpayers with refunds dropped from more than 265,000 in 2013 to about 250,000 in 2017. By contrast, the rise in the average tax refund in Delaware may be more attributed to an increase in the total amount refunded, as the number of returns with refunds remained consistent. Close to $985 million was refunded in 2017 compared to about $918 million in 2013.
Notably, states where the average tax refund has decreased over the past five years have seen larger changes than those were the average tax refund increased. The three states with the highest average five-year percentage change in tax refund – Connecticut, Wyoming and New York – saw decreases of more than 10%, in the average amount refunded to filers. The sharpest drop was in Wyoming. In 2013, the average refund for taxpayers in Wyoming was $3,723, while in 2017, it was $2,913, a 21.76% drop. In fact, from its peak over the five years in 2015, at $4,054, the average tax refund fell by 28.14%.
Financial Cost
Economists often refer to tax refunds as interest-free loans to the government. That is, taxpayers who receive a refund effectively grant the IRS money beyond what they actually owe in taxes throughout the year, but they receive only that same amount of money back after filing. Over the time elapsed, taxpayers could have invested the money or paid down their debt instead. The matrix below shows how much an individual gives up by lending money to the government instead of adding it to a savings account, investing it in the S&P 500 or paying down credit card debt.
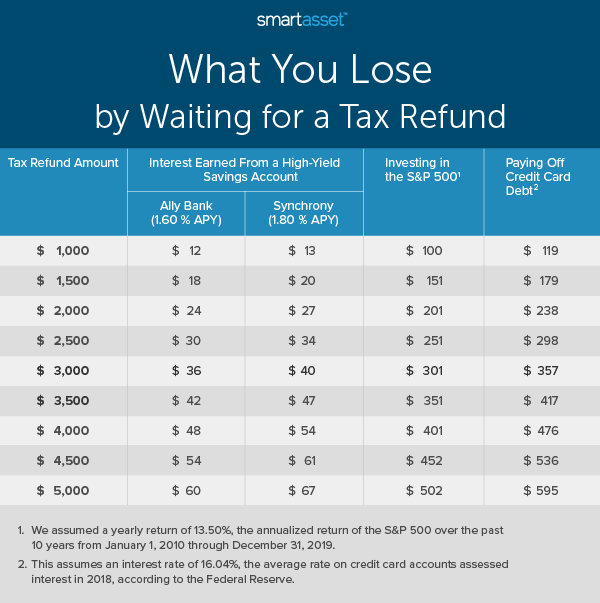
Savings accounts are offered by most financial institutions. In the above table, we look at two of our best savings accounts for 2020: Ally Bank and Synchrony High Yield. As of December 2019, Ally Bank had an annual percentage yield (APY) of 1.60%, while Synchrony High Yield had an APY of 1.80%. An individual with a tax refund of $3,000 who would have added that money to Ally or Synchrony cost themselves between $36 and $40 by withholding too much money for taxes throughout the year.
Investing one’s money in the stock market may lead to a greater financial reward, but that also comes along with greater risks. Though the S&P 500 rose by almost 30% in 2019, it fell by close to 40% in 2008 during the Great Recession. Due to variance between years, the above calculation uses the annualized return of the S&P over the past 10 years, 13.50%. If an individual with a tax refund of $3,000 put $250 every month in an index fund tracking the S&P, it would be worth about $301 more on April 15.
Individuals with credit card debt may lose the most by waiting for a tax refund. According to the Federal Reserve, the average rate on credit card accounts assessed interest in 2018 was 16.04%. By paying down credit card debt throughout the year, a taxpayer with a refund of $3,000 could save more than $350 by avoiding debt interest. Moreover, unlike investing in the stock market, there is no risk in paying down debt.
Though in all cases (assuming the stock market has a positive year) individuals may save more by having a tax refund of $0, not everyone may be able to do this. Low- and middle-income families receiving the Earned Income Tax Credit (EITC) or Child Tax Credit (CTC) effectively have to receive a large tax refund since these credits are issued as part of the refund.
Data and Methodology
Data for the first two sections of this report, National and State Trends, comes from the IRS. To find the average tax refund in each year, we divided the total amount of money issued in refunds by the total number of refunds issued. The five-year average tax refund for 2013 through 2017 was calculated by averaging the average tax refund in each year.
Data in the Financial Cost section relies on several assumptions, which may vary depending on the taxpayer’s situation. All four calculations assume that the tax refund was spread out evenly across the year (i.e. one-twelfth of the tax refund was received at the end of January, one-twelfth was received at the end of February and so on). Additionally, we assumed that the taxpayer received his or her refund on April 15, though some taxpayers may receive their refund earlier – or later, if they file for an extension.
Ally Bank and Synchrony High Yield were selected for the two savings account calculations as they are two of our best savings accounts for 2020. For the S&P 500 calculation, we assumed a return of 13.50%, which is the annualized return between January 1, 2010 through December 31, 2019, including dividends. This calculation does not account for taxes or fees. Finally, data for the credit card debt calculation comes from Federal Reserve’s 2018 Consumer Credit report.
Tips for Maximizing Your Savings
- Adjust your withholdings. If you’re on an employer’s payroll, you can adjust the amounts on your Form W-4 to change how much of your paycheck you allocate toward federal, state and local taxes each pay period. Calculate how much will go to the government and how much you’ll take home using our paycheck calculator.
- Be savvy with your tax refund. If you do receive a tax refund, spend it wisely. Many economists have theorized that its magnitude as a lump sum may cause taxpayers not only to view it differently than if the money was paid evenly in incremental payments throughout the year, but also to spend it differently. For instance, some studies have shown that car sales spike after Tax Day. While a new car may be a good investment, be sure to think about your retirement too. Our retirement calculator can help you determine what you’ve saved for retirement so far and how much more you may need.
- Consider a financial advisor. In addition to consulting with an accountant on your withholdings, a financial advisor may help you be better in control of your money. Finding the right financial advisor who fits your needs doesn’t have to be hard. SmartAsset’s free tool matches you with financial advisors in your area in five minutes. If you’re ready to be matched with local advisors that will help you achieve your financial goals, get started now.
Questions about our study? Contact us at press@smartasset.com
Photo credit: ©iStock.com/masterSergeant