 Written by
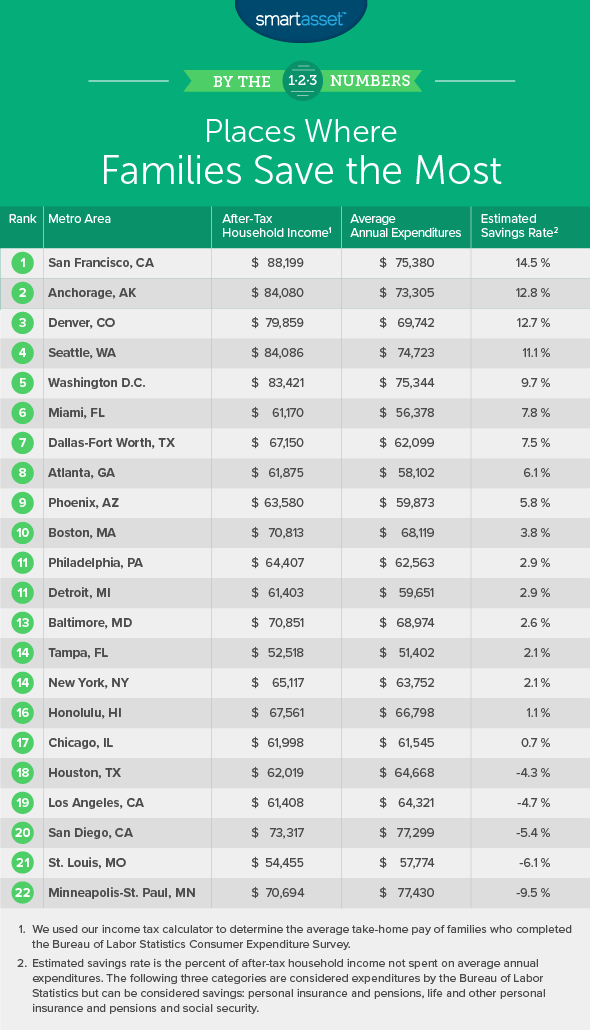
According to the latest Bureau of Labor Statistics Consumer Expenditure Survey, the average American household has an after-tax income of $64,175 and spends $57,311 per year. That leaves the average American household with a savings rate around 10.7%. But across the country, there are large disparities in savings rates. Some metro areas combine high-paying jobs with affordable housing, allowing households to fill their savings accounts. Other metro areas suffer from stagnant wage growth and bloated housing costs that hamper local residents’ ability to save.
Below we rank the places where families save the most by comparing average savings rates in 22 metro areas. To do this we compare after-tax income to average annual expenditures. Check out our data and methodology section below to see where we got our data and how we put it together to create our final list.
Key Findings
- Richer cities have higher savings rates – There is less keeping up with the Joneses across these 22 metro areas than you might expect, according to BLS data. While metro areas with wealthier residents did tend to spend more overall they also had the highest savings rates. The five metro areas with the highest after-tax household income had the five highest average savings rates.
- West dominates the top and the bottom – Of the 22 metro areas analyzed, eight of them are in the West category, according to the BLS. Those eight make up the top four ranking cities, and two of the bottom four with Phoenix and Honolulu ranking ninth and 16th respectively.
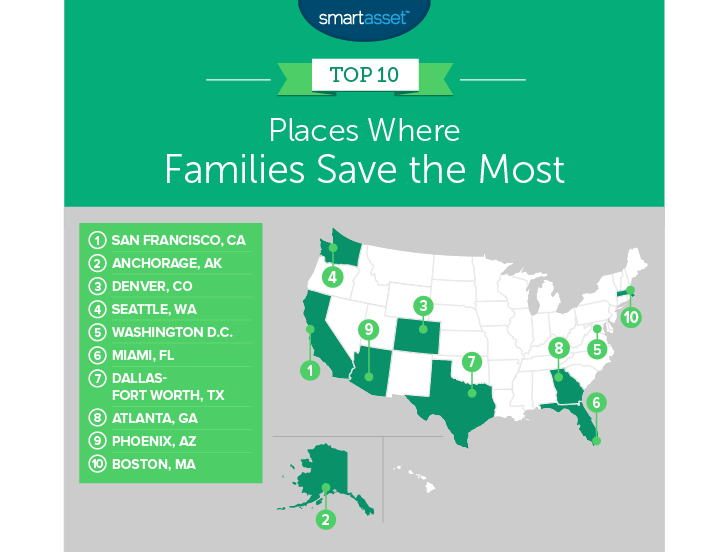
1. San Francisco, CA
San Francisco takes the top spot with an estimated savings rate of 14.5%. The average income among the 1,635 San Franciscan families who filled out the consumer expenditure survey was $118,098. After using our income tax calculator, we estimate an after-tax income of $88,199. The average household in San Francisco reported spending an average of $75,380 per year, $30,355 of which went to housing. That left the average San Francisco family with about $12,800 left over to spend how they pleased.
For San Francisco families who want to save more, trying to find a way to lower housing costs would be the most sensible route to take. San Francisco families spend the most in the survey on housing.
2. Anchorage, AK
Anchor town and the rest of its metro area comes in second. The reported average pre-tax household income in Anchorage is one of the highest in the survey at $104,465, which falls to $84,080 after factoring in federal income taxes. After spending about $73,305 per year we estimate the average surveyed Anchorage families saves 12.8% of their income per year. One reason they score so well is they don’t pay any Alaska state income tax.
The Anchorage metro area leads the way in spending on transportation with an annual transportation expenditure of just under $14,000 per year. That is the highest by about $500, beating out second-placed Houston. To add some perspective, Miami households spend $8,300 per year on transportation. That is the lowest amount in our survey.
3. Denver, CO
The Mile-High city and its outlying metro area take third, coming in only 0.1% behind Anchorage. The overall numbers also look pretty similar. We estimate that the average survey respondent in Denver has an after-tax income of $79,859 and annual expenditures of $69,742.
Housing is the single biggest budget item here, like it is in every other metro. We estimate average annual expenditures on housing in the Denver metro area to be just under $23,000. Survey data also reveals that Denver area households also spend the second-most on health care, about $5,700 per year, only behind Minneapolis-St. Paul.
4. Seattle, WA
The Seattle metro area is that last one with a double-digit savings rate. We estimate households who filled out the survey in this metro area have an after-tax income of $84,080. That is pretty similar to Anchorage. In total we estimate the Seattle metro area has an average annual expenditure of $74,700. Putting the after-tax income and the annual expenditures we see that Seattle has an estimated savings rate of 11.1%.
While that savings rate is good, there is always room to save in any budget. According to survey data households here could perhaps be a bit more frugal at meal times. Households here spend nearly $10,200 per year on food, $5,900 of which is spent on food at home. Seattle ranks second and first in those two metrics.
5. Washington D.C.
The nation’s capital seems to be filled with thrifty households. This metro area has the fifth-highest average savings rate of 9.7%. This metro area had the wealthiest households. The average pre-tax household income here was 113,997. After taxes that income figure fell to $83,421. With annual expenditures reaching $75,344 the average Washington D.C. household has around $8,100 in disposable income.
6. Miami, FL
Miami, the metro area with the lowest average pre-tax income takes sixth. Our data shows that average annual expenditures here total $56,378, the lowest in the study by some distance. That leaves Miami households with about $4,800 in disposable income, for a total savings rate of 7.8%.
With the lowest total spending in the study it is difficult to say where Miami could afford to save more. One candidate is apparel and services. Miami households spend nearly $3,100 per year in that category, the second-highest amount in the study.
7. Dallas-Fort Worth, TX
Dallas-Fort Worth takes seventh with an average savings rate of 7.5% on after-tax income of $67,150. Residents here get a break on their taxes thanks to the lack of state income tax in Texas. Transportation and housing are the main culprits stopping residents here from saving more. About 50%, or $31,000, of the average Dallas-Fort Worth annual expenditures goes to housing and transportation costs.
8. Atlanta, GA
Another Southern metro area comes in eighth. Atlanta residents report a pre-tax income of $80,365, which equals an after-tax income of $61,875. With average annual expenditures equaling $58,102 we estimate Atlanta has an average savings rate of 6.1%.
One area where Atlanta households could try and find some space in their budget is in transportation. Around 18% of their average annual expenditures goes to transportation, the third highest rate in the study. In particular new vehicle purchases add up at an average of $5,000 per household. That cost is a good candidate savings opportunities.
9. Phoenix, AZ
Phoenix claims one of the last spots in this top 10. Despite being a fairly popular spot for retirees, Phoenix had one of the younger average ages for respondents filling out the consumer expenditure survey at 48. In total average annual expenditures equaled $59,873, while average after-tax income equaled $63,580. This left the Phoenix area with disposable income of $3,707 good enough for a savings rate of 5.8%.
10. Boston, MA
The Hub comes in tenth. This metro area had a savings rate of 3.8%. After tax-income averaged to $70,800 while average annual expenditures totaled $68,119. This means the average Boston area household had a disposable income of just under $2,700. Not a ton when you are trying to save for retirement or buy a home but better than nothing.
Data and Methodology
In order to rank the places where families save the most we looked at data for all 22 metro areas the Bureau of Labor Statistics has expenditure data for. Specifically we looked at the following two metrics to create this ranking:
- Average after-tax income. To find this number we ran the average income before taxes figures through our income tax calculator. Data on pre-tax income figures comes from the Bureau of Labor Statistics Consumer Expenditure Survey for 2016.
- Average annual expenditures. Data comes form the Bureau of Labor Statistics Consumer Expenditure Survey for 2016.
To create our final rankings we subtracted the average annual expenditures from the average after-tax income. This gave us a total savings figure. We then divided the total savings by average after-tax income to estimate a savings rate. We ranked the metro areas from highest to lowest based on this savings rate.
Tips for Maximizing Your Savings
- Get the right savings accounts – By switching from a traditional bank to an online only bank like Ally or Synchrony you can increase your APY by up to 180 times compared to what traditional banks offer. This does mean however you won’t have access to any brick and mortar locations.
- Talk to an expert – A financial advisor can make sure your savings are going toward their best uses. Whether you are trying to save for retirement, a down payment or just simply trying to optimize your investments a financial advisor will make sure you leave no stone unturned in your search for financial independence. If you are wondering where to find the best financial advisors check out SmartAsset’s financial advisor matching tool. It will match you with up to three local financial advisors who fit your investing needs.
Questions about our study? Contact us at press@smartasset.com.
Photo credit: ©iStock.com/Rawpixel