 Written by
City dwellers can get pretty riled up when extolling the virtues of their chosen city. Just try talking to any New Yorker. But have you ever wondered how your city compares to others in practical factors like housing costs, crime and walkability? In other words, which cities in the United States are the most livable? We at SmartAsset were curious so we ran the numbers on 93 of the biggest cities in the country. Read on to see what we found out.
Check out our cost of living calculator.
Study Specifics
To find the most livable cities we considered six factors including population density. The main assumption that we made for this study is that high population density is a positive factor. The reasoning behind this is that since population density and establishment density are correlated, it’s a good way of measuring access to things like grocery stores, laundromats and restaurants. Read the Data and Methodology section below for a full breakdown on where we found the data and how we interpreted it.
Key Findings
- California living – California is the most well-represented state in our study. Eight of the cities in the top 25 are located in the Golden State.
- Unwalkable South – Southern cities did not fare as well in our study. Only two Southern cities (both in Texas) cracked the top 25. This was mostly due to low levels of walkability. Five of the bottom 10 cities are in the South and all had poor walkability scores. Notably Winston-Salem, North Carolina was ranked at the second-to-last livable city, as well as the second-least walkable.
- Memphis blues – Memphis ranked dead last. According to our data, Memphis ranks 92nd for violent crime and 90th for property crime. Another lowlight is its 13.4% unemployment rate.
This is the 2016 edition of the most livable cities in the U.S. Check out the 2017 edition here.
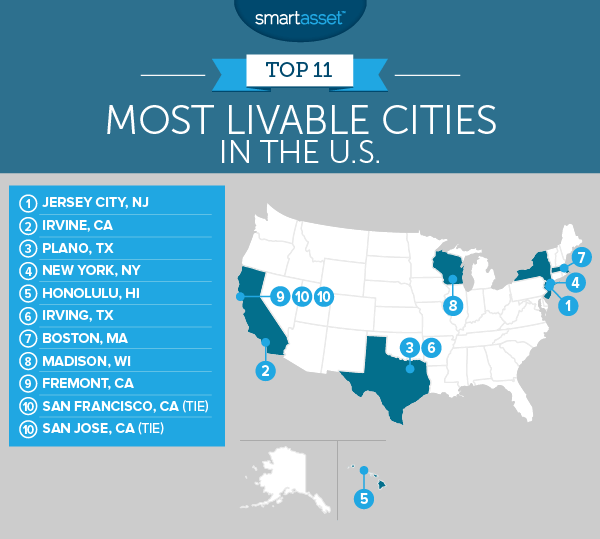
1. Jersey City, New Jersey
Jersey City snagged the title as the most livable city in the United States. Of the 93 cities in our study, it has the third-highest population density, third-highest income after housing and is fourth in walkability. Because of the city’s proximity to New York, a person living there can easily work in Manhattan (where the jobs tend to be higher paying), while enjoying the lower living costs associated with Jersey City. Jersey City residents have $35,452 on average to play with after housing costs.
Check out our budget calculator.
2. Irvine, California
Irvine came close to being first overall in our study but ultimately fell short by 0.6 points on our index. Irvine doesn’t quite have the walkability of Jersey City but it’s much safer. Irvine has the lowest rates for both violent and property crimes in our entire study.
3. Plano, Texas
Income after housing in Plano is a wallet-bulging $30,949 on average and the unemployment rate is only 5.9%. Those numbers are good for taking the 13th and third spots in those particular metrics, respectively. Violent and property crime rates are also low in Plano.
4. New York, New York
New York is the most walkable city according to our data and thanks to the highest population density in the country, just about anything you could need is nearby. One statistic that stood out is that New York has the third-lowest property crime rate in our study at 4,200 per 100,000 people. The Big Apple has come a long way since getting its reputation as a crime-ridden city.
5. Honolulu, Hawaii
For anyone looking for livable tropical fun, Honolulu is probably your best bet. The Hawaiian capital has the lowest unemployment rate of any city in our study. It’s worth noting that housing costs are high in Honolulu. The annual median housing cost is $16,380.
6. Irving, Texas
Like Plano, Irving is highly livable because of its economic situation. Income after housing in Irving is $30,494 on average, and its 7.5% unemployment rate is the 17th lowest in the study.
7. Boston, Massachusetts
Boston, famous for Faneuil Hall and the Red Sox, is one of the oldest cities in the country. It’s also one of the most walkable, according to our data. Boston isn’t higher in our ranking because it lost points for its relatively high crime and unemployment rates.
8. Madison, Wisconsin
SmartAsset recently ranked Madison as one of the least-stressed cities in America, as well as one of the best college towns to live in, so it was no surprise to see it pop up here, too. The Midwest city has a low unemployment rate (5.8%) and decent income after housing ($27,133 on average).
9. Fremont, California
Although Fremont isn’t that close to Irvine geographically speaking, these two Californian cities have a lot in common. Both are coastal cities with low crime rates, similar unemployment rates and they have the exact same walkability score. Fremont isn’t quite as safe as Irvine and its residents have less to spend after housing costs, which is why it’s ranked lower than Irvine.
10. (tie) San Francisco, California
By some metrics San Francisco looks like it should be higher on our list. It is ranked second in walkability, population density and income after housing. But the City by the Bay took a hit when it comes to crime. San Francisco has one of the worst property crime rates. According to our data, it ranks 81st out of 93 cities. For violent crime, it ranks 62nd.
10. (tie) San Jose, California
San Jose tied with San Francisco on our index. While San Francisco has wide variance in its rankings, San Jose has more consistency. It scored in the top half for every metric we analyzed. San Jose is considerably less walkable than SF, but it ranked better for both violent and property crime rates.
Data and Methodology
To determine the most livable cities, we considered the following six metrics:
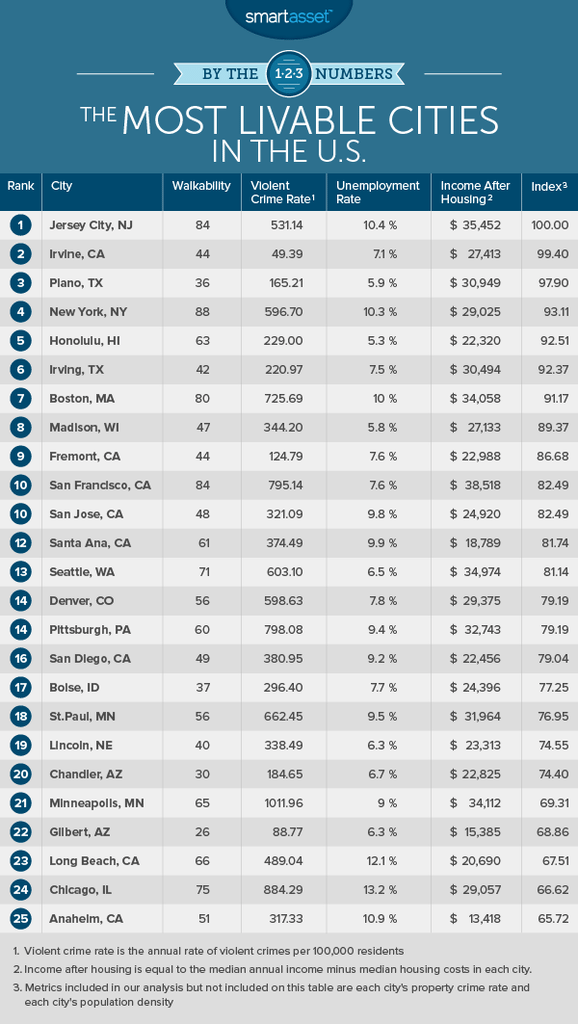
- Walkability. This is calculated on a 0-100 scale. A lower number means the city is less walkable and a higher number means it’s more walkable. Data on a city’s walkability comes from walkscore.com.
- Violent crime rate. This is the number of violent crimes per 100,000 residents. Violent crime rates are based on 2014 data from local police department websites and the FBI’s Uniform Crime Reporting Database.
- Property crime rate. This is the number of property crimes per 100,000 residents. Property crime rates are based on 2014 data from local police department websites and the FBI’s Uniform Crime Reporting Database.
- Unemployment rate. Data from each city’s unemployment rate comes from the U.S. Census Bureau.
- Income after housing. This is the annual median earnings for full-time workers minus the annual median housing cost in each city. For the purpose of this study, we considered places with high incomes after housing to be more livable. Data for this metric came from the U.S. Census Bureau.
- Population density. This is measured in people per square mile. Data comes from the U.S. Census Bureau. For this study, we considered places with higher population densities to be more livable.
In order to produce our overall ranking, we ranked all 93 cities in each of the six metrics. We then averaged those rankings giving full weight to all metrics except population density, which we gave a half weighting.
We calculated an overall index score based on those averages. The highest-ranking city got a score of 100 and the lowest-ranking city got a score of 0.
Questions about our study? Contact us at press@smartasset.com.
Photo credit: ©iStock.com/eugeniomarongiu