 Written by
Owning a pet is an investment, and choosing an affordable and pet-friendly city is an important consideration for renters or people looking to buy a home. Dogs are one of the more expensive pets to have since they often require more care than other animals. In order to discover where owners could best raise their pooches, SmartAsset looked more into the most dog-friendly cities in America.
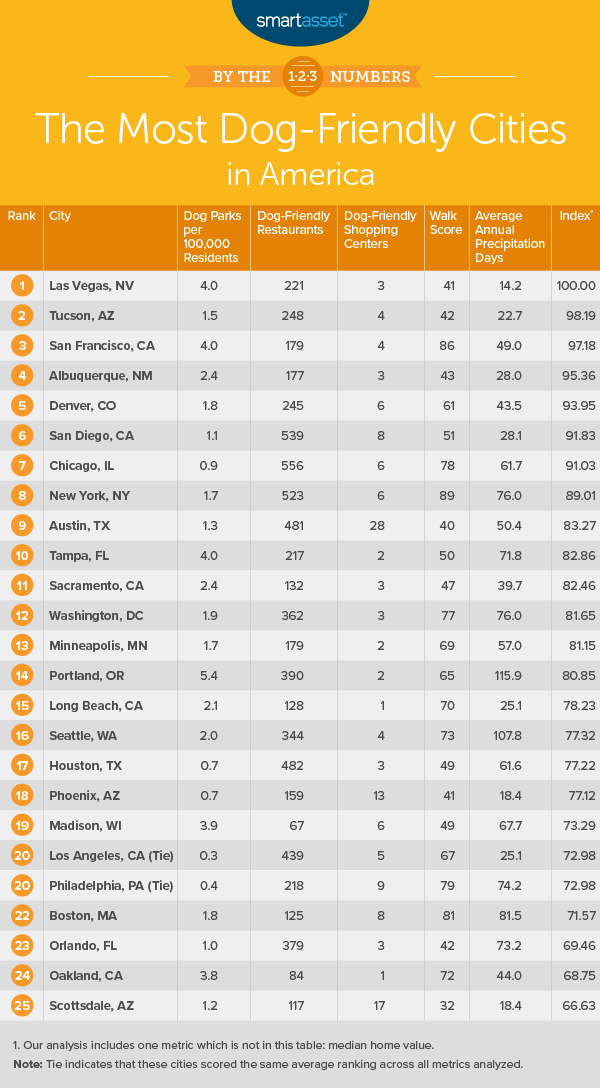
To determine the most dog-friendly cities in America, we examined six metrics in particular: median home value, concentration of dog parks, walk score, number of dog-friendly restaurants, number of dog-friendly shopping centers and average amount of precipitation per year. For more details on data sources and how we put all the information together to create our final rankings, see the Data and Methodology section below.
This is SmartAsset’s fourth annual study on dog-friendly cities. Check out the 2018 rankings here.
Key Findings
- Big cities. Some of the largest cities in the U.S. also happen to be some of the most dog-friendly. New York, Chicago and San Diego rank first, third and eighth in terms of population in 2017, according to Census Bureau data, and on our list of dog-friendly cities they rank eighth, seventh and sixth, respectively.
- The West is still a great place. Like last year, many of our top dog-friendly cities are out West. They include Las Vegas, Tucson, Albuquerque, Denver and two cities in California – San Francisco and San Diego. These Western cities generally offer fewer days of precipitation relative to other cities we considered as well as large numbers of dog-friendly restaurants and shopping centers.
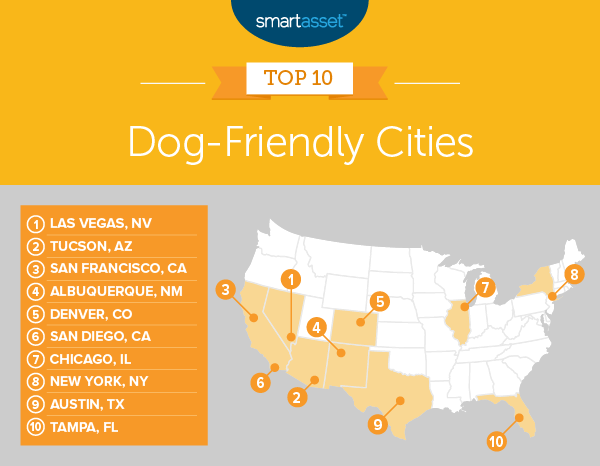
- Las Vegas, NV
Moving up from third in last year’s study, Las Vegas, Nevada offers many dog-friendly parks, restaurants and shopping centers along with a temperate climate. Las Vegas ties for the fifth-highest number of dog parks per 100,000 residents out of all 100 cities in our study and the 18th– and 17th-highest number of dog-friendly restaurants and shopping centers, respectively. Las Vegas is also a relatively affordable city for dog owners. According to the Census Bureau’s most recent American Community Survey, the median home value in Las Vegas is $245,500.
- Tucson, AZ
The cost of owning a dog can add up, and Tucson, Arizona may be a top choice for budget-conscious dog owners. Tucson has the lowest median home value of any city in our top 10 and the 22nd-lowest median home value overall. According to Census Bureau estimates, the median home value was $150,400 in 2017.
Like Las Vegas, Tucson experiences little rain throughout the year, a plus for dog owners who like to take walks with their pet. Currentresults.com estimates that Arizona gets rain an average of approximately 22 days per year. Retiree dog-owners may find Tucson particularly attractive: Of all American cities, Tucson saw the third-highest net increase in retirees moving there.
- San Francisco, CA
Unlike Tucson, San Francisco, California is an expensive place to live. It has the highest median home value of any city in our study exceeding $1 million in 2017. However, San Francisco offers a variety of other benefits for dog owners. It ties for the fifth-highest number of dog parks, at four dog parks per 100,000 residents. And despite its notorious hills, San Francisco is very walkable city. Walkscore.com gives San Francisco a score of 86, the third-highest score of any city in our study.
- Albuquerque, NM
Albuquerque, New Mexico ranks in the top half of all cities across all metrics. Albuquerque’s median home value was less than $200,000 in 2017, and there are about two dog parks per 100,000 residents, meaning the city ranks 39th and 13th for those two metrics, respectively. Of all metrics, Albuquerque does the worst in terms of its walkability, just making it into the top half of all the cities in the study.
- Denver, CO
Denver, Colorado is a great option for dog owners who love the outdoors. Though it has more average annual days of precipitation than Tucson or Albuquerque, it still ranks in the top third of all 100 cities in the study for this metric. Moreover, Denver offers great nearby hiking options for dogs with more stamina.
Across all metrics, Denver does the worst in terms of affordability, as the city is becoming an increasingly desirable place to live. In 2016, the median home value was $360,900 and in 2017, the median home value was $395,100 – an increase of approximately 9.50% between the two years.
- San Diego, CA
The second California city in our top 10, San Diego is less expensive than San Francisco though still expensive relative to seven other cities in our top 10 and relative to 89 other cities in our study overall. In 2017, the median home value in San Diego was $600,300. However, San Diego offers a large number of dog-friendly restaurants and shopping centers. In fact, July 2019 data from BringFido.com shows that, at 539, San Diego has the second-highest number of dog-friendly restaurants of any of the 100 cities in our study.
- Chicago, IL
Chicago, Illinois is a great option for dog owners hoping to bring their dogs along with them to restaurants or on errands. It has the most dog-friendly restaurants of any city in our study. According to BringFido.com, there were 556 dog-friendly restaurants in Chicago in July 2019. In comparison, the average number of dog-friendly restaurants across all 100 cities in July 2019 was roughly 140. Additionally, Chicago ties for having the seventh-highest number of dog-friendly shopping centers of any city in our study, with BringFido.com also reporting that it has six dog-friendly shopping centers.
- New York, NY
New York, New York is an extremely walkable city that has many dog parks available. It ranks first overall in terms of walkability and ties for 27th-highest in terms of the number of dog parks per 100,000 residents. Unfortunately, walking outside or going to a dog park may not always be the best option, as rain is not uncommon in New York. According to data from Currentresults.com, the city has an average of almost 76 days of precipitation annually. In comparison, the average annual days of precipitation across all cities is approximately 54.
- Austin, TX
Like San Diego and Chicago, Austin, Texas shines when it comes to dog-friendly restaurants and shopping centers, ranking fifth and first overall on the two metrics, respectively. Austin has approximately 341 more dog-friendly restaurants and almost 26 more dog-friendly shopping centers than the average number of each of these kinds of establishments across all 100 cities.
- Tampa, FL
Moving up from 17th in last year’s study, Tampa, Florida has improved the availability of dog-friendly places in the city over the past year. In our 2018 study, there were 3.5 dog parks per 100,000 residents according to data from ParkScore. In comparison, ParkScore reported in 2019 that there were four dog parks per 100,000 residents. Additionally, there are eight more dog-friendly restaurants and one more dog-friendly shopping center than last year. According to BringFido.com, there were 217 dog-friendly restaurants (ranking 20th overall) and two dog-friendly shopping centers (ranking 31st overall) in Tampa in July 2019.
Data and Methodology
To find the most dog-friendly cities, SmartAsset pulled data for 100 of the largest cities in America. We compared the dog-friendliness of cities across the following six metrics:
- Dog parks per 100,000 residents. This metric looks at the number of dog parks per 100,000 residents. Data comes from the Trust for Public Land’s 2019 ParkScore Index.
- Dog-friendly restaurants. This factor looks at the number of restaurants that allow dogs in outdoor seating areas. This data comes from BringFido.com and was pulled in July 2019.
- Dog-friendly shopping centers. This metric represents the number of shopping centers that allow dogs. This data comes from BringFido.com and was pulled in July 2019.
- Median home value. Data comes from the Census Bureau’s 2017 1-year American Community Survey.
- Walk score. This factor measures the walkability of each city. Data comes from Walkscore.com.
- Average annual days of precipitation. This metric looks at the average number of days a year that a state gets rain. Data comes from Currentresults.com.
First, we ranked each city in each metric, giving different weightings to each metric. Dog parks, dog-friendly restaurants and dog-friendly shopping centers received a 20% weighting. Walk score and average days of precipitation received a 15% weighting. Median home value received a 10% weighting. We then found each city’s average ranking using the above weights for each metric. The city with the best average ranking received a score of 100. The city with the worst average ranking received a score of 0.
Tips for Finding an Affordable Home
- Be realistic about your ability to buy. If you’re considering buying vs. renting, take a close look at your budget, your pets’ needs and your overall financial situation. You can use our free online tool to compare your options.
- Don’t waste time barking up the wrong tree. Making important financial decisions that affect the well-being of you and your household can be difficult to navigate. Don’t waste your precious time speaking to inexperienced individuals – talk to an expert financial professional to sort things out. Finding the right financial advisor that fits your needs doesn’t have to be hard. SmartAsset’s free tool matches you with financial advisors in your area in 5 minutes. If you’re ready to be matched with local advisors that will help you achieve your financial goals, get started now.
Questions about our study? Contact us at press@smartasset.com
Photo credit: ©iStock.com/LeoPatrizi