 Written by
STEM jobs are some of the most desired in the country. These jobs tend to offer the best pay and the best benefits. However, as inequality remains a problem in American society, more people are starting to focus on who are employed in these fields. This issue recently came to the fore when Google let go of an employee who released an anti-diversity memo. Below we look through the data to find the best cities for diversity in STEM.
In order to find the best cities for diversity in STEM, we looked at data for the 50 cities with the largest STEM workforce. We analyzed this workforce to see who had the biggest racial diversity and gender diversity. Check out our data and methodology below to see where we got our data and how we put it together.
This is the third annual version of this study. Check out the 2016 version here.
Key Findings
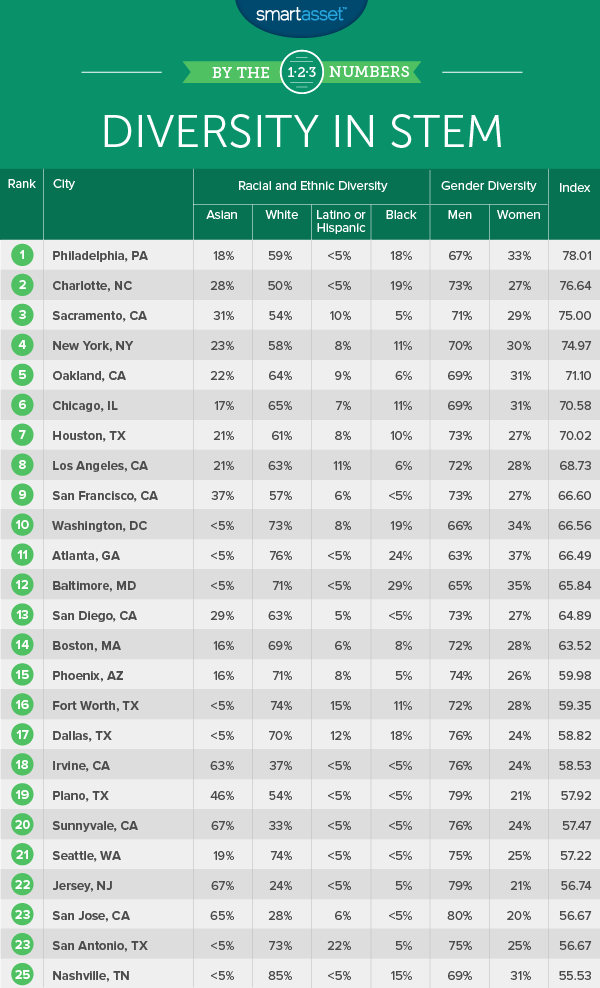
- Gender diversity problem – In general, across the cities with the largest STEM workforces, women tend to be under-represented. On average women only occupy 26.4% of STEM jobs in each of the cities we analyzed.
- Coastal diversity – All of our top 10 cities are coastal cities. These cities tend to have more racial diversity to begin with, which may explain why they have more diverse STEM workforces.
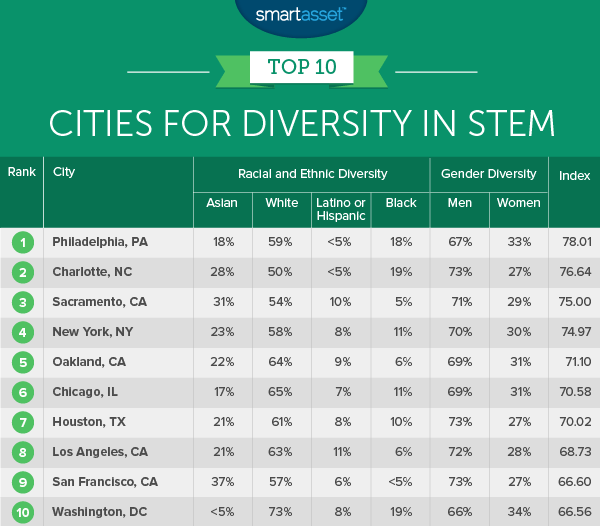
1. Philadelphia, Pennsylvania
The City of Brotherly Love jumps four spots to first. This city scored high in both racial diversity and gender diversity. Women make up around 33% of the total STEM workforce. That is the fourth-highest in our study.
Around 18% of people employed in STEM jobs here are black which is the third-highest rate in our top 10. This helped give Philadelphia the fourth-best racial diversity score.
2. Charlotte, North Carolina
Charlotte has the most racially diverse STEM workforce. About 19% of STEM workers in Charlotte are black and 28% are Asian. Men dominate the tech scene in Charlotte which hurts this city’s gender diversity score. About 73% of the STEM workforce here is male.
3. Sacramento, California
Last year’s No. 1 city finishes third. Sacramento had the third-most racially diverse STEM workforce. Around 31% of STEM workers in this city are Asian, the second-most in our top 10. This city also has the second-highest concentration of Latino STEM workers in our top 10.
One way Sacramento could improve its score in this city is by hiring more women. Only about 29% of workers here are female.
4. New York, New York
New York is known as a place which has traditionally supported a wide variety of workers. According to data from the Census that remains true. About 11% of the STEM workforce in New York is black, 23% is Asian and 8% is Latino. That leaves 58% of STEM employees who are white.
This city scores slightly better than Sacramento in terms of gender diversity. About 30% of STEM workers in New York are women. What is particularly troubling about that statistic is that working age women actually outnumber working age men in New York by about 200,000.
5. Oakland, California
The Oakland STEM workforce is fairly diverse. White workers dominate but black workers, Asian workers and Latino workers all represent more than 5% of the workforce. Asian workers are the second-most represented, making up 22% of the workforce.
One good sign for women, despite not being perfectly well represented in STEM, is that they tend to earn similar amounts as their male colleagues. Full-time working woman earn about $52,600 per year and full-time working men earn $54,300 in Oakland.
6. Chicago, Illinois
Around 65% of STEM workers in Chicago are white, a score which slightly hurts its racial diversity score. However, thanks to decent representation from other races in its STEM workforce, Chicago still has a top 10 racial diversity score.
Women also make up 31% of the STEM workforce which is not a large amount in absolute terms (woman make up about half the workforce in Chicago), but compares favorably to other cities on this list.
7. Houston, Texas
Houston has the fifth-highest score on our racial diversity index. One big reason for that is the large concentration of workers who are black or Asian. Asian workers make up 21% of the workforce while black workers make up 10% of the workforce.
Women only make up 27% of the workforce and in general are paid less than men. The average full-time working woman earns about 89% of what the average full-time working man does.
8. Los Angeles, California
Los Angeles is known as a diverse city. The STEM workforce here is also diverse, at least by national standards. Around 63% of the STEM workforce here is white, while 21% is Asian and 11% is Latino. That gives Los Angeles the highest representation of Latinos in our top 10 and eighth-highest overall.
However, more women could probably be hired in STEM jobs in the City of Angels. Women only make up 27.5% of the STEM workforce.
9. San Francisco, California
San Francisco has a top 10 racially diverse STEM workforce. One area it could improve its score in our race index is by hiring more black workers. Less than 5% of the San Francisco STEM work force is black. That is the lowest rate in our top 10.
But at the same time San Francisco also has the largest concentration of Asians in the STEM workforce in our top 10. Around 37% of STEM workers in San Francisco are Asian.
10. Washington, D.C.
The nation’s capital rounds out our top 10. The STEM workforce here is largely dominated by white workers which hurts its racial diversity index. Around 73% of STEM workers here are white. What D.C. does well is support women in tech. Washington, D.C. has the third-highest rate of women in the STEM workforce at 34%.
Data and Methodology
To find the cities with the most diverse STEM workforce, we looked at data on the 50 cities with the largest STEM work forces. Specifically, we compared them across the following two metrics:
- Racial diversity index. We calculated this based on the racial diversity of a city amongst the main Census Bureau groups. Cities with a more equally distributed workforce across the racial groups received a better score.
- Gender diversity index. This measures the number of women in the workforce compared to men. Any city which had a perfect 50/50 split received a 100.
We then averaged these two indexes to create our final score, which we used to rank our cities.
Data for both metrics came from the Census Bureau’s 2016 1-Year American Community Survey.
Tips for Moving to a New City for a Career Switch
- Making a move across the country for a new job can mean incurring large costs. Since most of these costs are unavoidable you may want to consider putting them on a rewards credit card. By putting the costs of hiring movers, plane tickets or gas and possibly a hotel room onto a credit card, you should be able to quickly hit the minimum spend amount and unlock the best rewards that you can use in the future. Of course, it’s important to always spend responsibly when you’re using a credit card. Never charge more than you can comfortably afford to pay and pay your bill in full and on time each month.
- If you don’t have enough saved to cover the move upfront and the moving costs will be too hard to tackle in one billing cycle, you may want to use a 0% APR card instead. That way you’ll have more time to pay off the costs (between six and 18 months typically) without racking up additional interest charges.
- When moving to a new city you need to decide to you want to rent or buy. Renting can give you flexibility but in the long term buying could make more financial sense. Our rent vs buy calculator can help you decide what the right option is for you.
- If you do decide to buy there are still decisions to make. For example whether you want to go with a 15-year mortgage or a 30-year mortgage is a big decision. With 15-year mortgage you will own your house faster, but you will be saddled with higher monthly payments. Make sure you buy a house you can afford as well.
The data analysis for this study was completed by Nick Wallace.
Questions about our study? Contact us at press@smartasset.com
Photo credit: ©iStock.com/TommL