 Written by
If the American economy was the Titanic and the iceberg that sank the Titanic was the financial crisis, then STEM jobs would be the few available life boats rescuing passengers. Similar to the dilemma of who had access to those life boats, who works in STEM fields has not been equally distributed. While it was mostly woman and children saved from the icy arctic waters, today it is mostly whites and men being spared the effects of a sluggish economy.
This is the 2016 version of this study. Compare it to the 2015 study here.
Great benefits (think 401(k) and health insurance) in particular are hard to come by for non-STEM workers especially with the growth in contract work here in the U.S. As the supply of STEM jobs has grown there are concerns from both business communities and the White House that the majority of those positions will go to non-minorities.
Initiatives like the National Academic STEM Collaborative have been implemented by the federal government to increase diversity in STEM education while some businesses have created their own diversity initiatives. However, the lack of diversity persists and is not uniformly distributed. SmartAsset took a look at the data to see which cities have the most diverse STEM workforce. This is a follow up on our 2015 study.
Looking to move for a job opportunity? Check out our cost of living calculator.
Key Findings
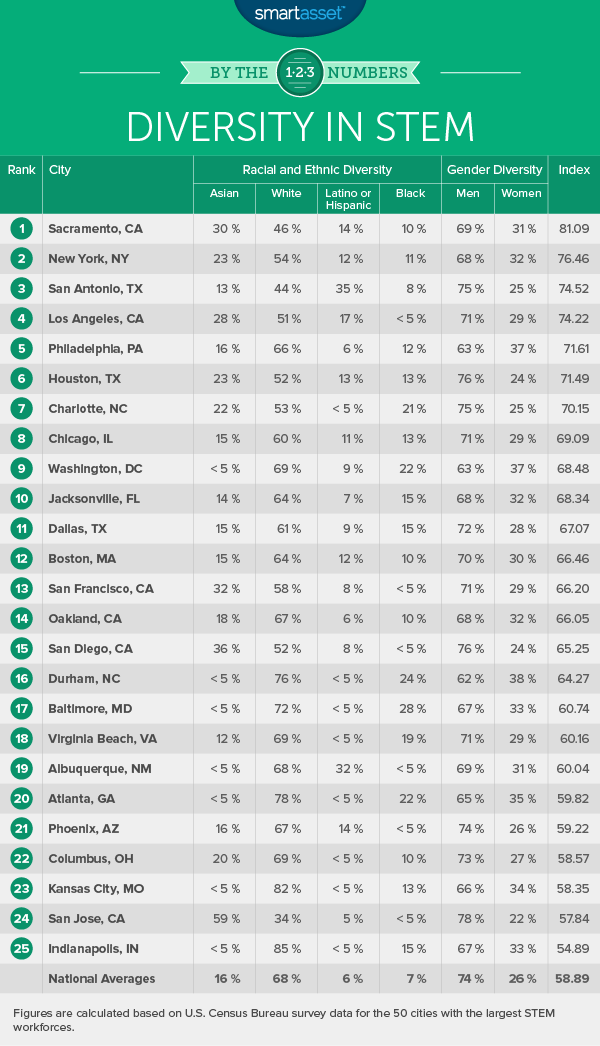
- The data shows improvement. According to the data we looked at, the STEM working world is more diverse than last year. The national index this year was 58.89 compared to last year’s 53.50.
- Where are the women? In general the STEM workforce is more diverse in terms of race but less diverse in terms of gender. For example men make up 53% of the workforce nationally but 74% of the STEM workforce.
- Tech hubs getting more diverse. Some of the typical STEM hubs showed an improvement from last year as well. San Francisco, New York and Boston all improved from last year’s ranking moving up to 13th, 2nd and 12th respectively. This may show that larger companies are embracing diversity as a larger part of the business plan.
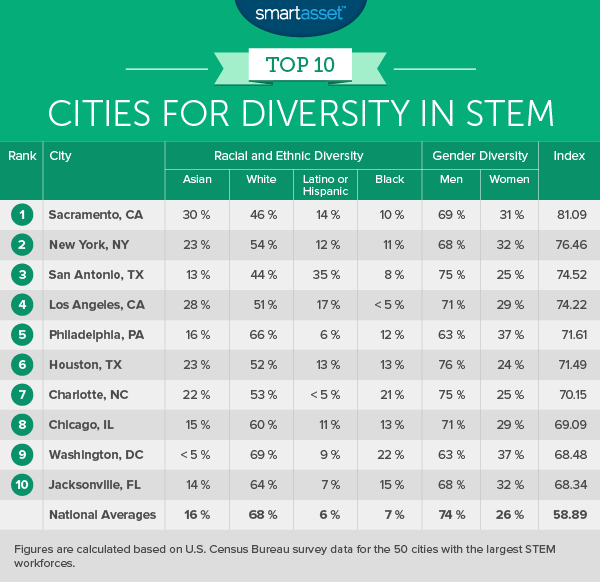
1. Sacramento, California
Sacramento rose to first place in this year’s rankings (from 3rd last year). Sacramento has one of the largest local innovation funds in the country ($8.2M) which may help explain the diversity. Government-backed initiatives often prioritize fairer hiring practices.
2. New York, New York
New York was the highest climber from last year’s top 10, moving from 9th to 2nd place. It fared relatively well in every category and has one of the most balanced work forces in terms of race. New York is also the birthplace of an organization called GirlsWhoCode a company dedicated to closing the gender gap in technology.
3. San Antonio, Texas
San Antonio has climbed all the way from 19th last year to 3rd on our list. This is mostly due to having a large percentage of Latino or Hispanic STEM workers. The numbers show San Antonio has not made any progress from last year’s study in terms of gender diversity.
It is still one of the most male-dominated cities in the country at 75%. Gender appears to be a Texas-wide problem as other notable Texas cities like Houston and Dallas are also 70-something percent male.
4. Los Angeles, California
Similar to San Antonio, Los Angeles does well in this list because of its racially diverse workforce. Similar to many other California cities, Los Angeles has a large Asian presence making up 28% of their total STEM work force. That ranks 6th on our list in that category.
5. Philadelphia, Pennsylvania
Philadelphia has traditionally done well in our STEM diversity studies so it is probably not a surprise to see them so high on this index. One disappointment is that they actually scored 4 points higher last year. The decrease comes because of a drop in ethnic diversity among the STEM workforce. The numbers show a 9% increase in White workers compared to 2015. On the bright side they are still one of the best cities for gender diversity, with women making up 37% of their STEM workforce. This is compared to the national average of 26%.
6. Houston, Texas
The story of the STEM workforce in Houston is much the same as it is in the rest of Texas, a fairly balanced racial profile made up mostly of men. Houston is unique in Texas in that Asian workers make up the largest minority group in that workforce at 23%. This is an increase from last year’s study where that number was 21%.
Related Article: The True Cost of Living in Houston
7. Charlotte, North Carolina
Charlotte is a unique city because according to our study it is the only city to have two minorities making up greater than 20% of their STEM workforce. They would have scored better if there were more women in that workforce. In Charlotte only 25% of the STEM workforce is female.
8. Chicago, Illinois
The windy city has blown all the way up to 8th from 16th place in last year’s study. The Chicago Foundation for Women recently launched the 100% Project, which aims to end pay inequality in Chicago by 2030. While that is a long way off if they are successful, we could see more gender diversity in the Chicago STEM workforce as women are attracted by fairer hiring practices.
9. Washington DC
Similar to Philadelphia, the nation’s capital has a good track record for gender diversity in our studies. The city ranked first in our women in tech study earlier this year. As far as gender diversity they were second only to Virginia Beach in terms of women’s employment in STEM.
Related Article: The Best Cities for Women in Tech
However, this is in fact a decrease from last year where 42% of STEM workers were women in DC. This could be a benign change due to either the change in Census collection methods or a result of the transient nature of the DC region.
10. Jacksonville, Florida
The only Florida city to make the top ten in either year of this study, Jacksonville is a newcomer as a STEM hub. This may be at least partially due to the recent $30 million “It’s Your Money Tax Cut Budget” work force training initiative to create a new generation of STEM workers in Florida.
The initiative helps to fund training for high skill STEM workers and combined with the low taxes in Jacksonville, may be a reason why the city made the criteria cut this year. As far as diversity, Jacksonville has one of the larger percentages of Black STEM workers, at 15% compared to the national average of 7%.
Methodology & Data Sources
To find the cities with the most diverse STEM workforce, we looked at U.S. Census data on the demographics of STEM employment in the 50 U.S. cities with the largest STEM workforce.
First, we looked at the racial and ethnic makeup of a city’s STEM workforce. For each city, we calculated an index score based on the distribution of the workforce among the eight primary racial and ethnic groups tracked by the U.S. Census Bureau. The more evenly spread a city’s workforce was among these eight groups, the higher the score.
The city with the most racial and ethnic diversity was Sacramento, California. It received a 100. Any city with 100% of its STEM workforce concentrated in a single racial or ethnic group scored a zero.
Find out: How much house can I afford?
Next, we calculated a similar score based on gender diversity. A city with a STEM workforce equally split between men and women would receive a 100 for this score, while a city in which women made up 10% or less of the STEM workforce scored a zero.
Lastly, we averaged these two scores. A higher score reflects higher racial, ethnic and gender diversity.
Note: For this study we used the same methodology as last year to ensure comparability. The one caveat is that the Census stopped doing their 3-year survey, so this year’s study is based on the Census 1-year survey. Because of this change in our data source, we compared 50 cities (as opposed to the 210 last year). It’s important to note that some of last year’s best performers fell out of our top ten list due to lack of data rather than from poor performance.
The data analysis for this study was completed by Nick Wallace.
Questions about our study? Contact us at blog@smartasset.com
Photo credit: ©iStock.com/TommL