 Written by
Much has been written about rent increases in America’s largest cities. Data from the U.S. Census Bureau shows that in cities like Boston, New York and San Francisco, rents have risen by 10-15% from 2012 to 2015. An interesting component of this discussion is the rise in incomes, as that often accompanies the rise in rent. We at SmartAsset were curious about the cities where incomes are rising faster than rents.
Find out now: Should you rent or buy?
We looked at the 50 largest cities in the U.S. and compared the rent-to-income ratio in 2012 and in 2015. Read the Data and Methodology section below to see where our data came from and how we measured it.
Key Findings
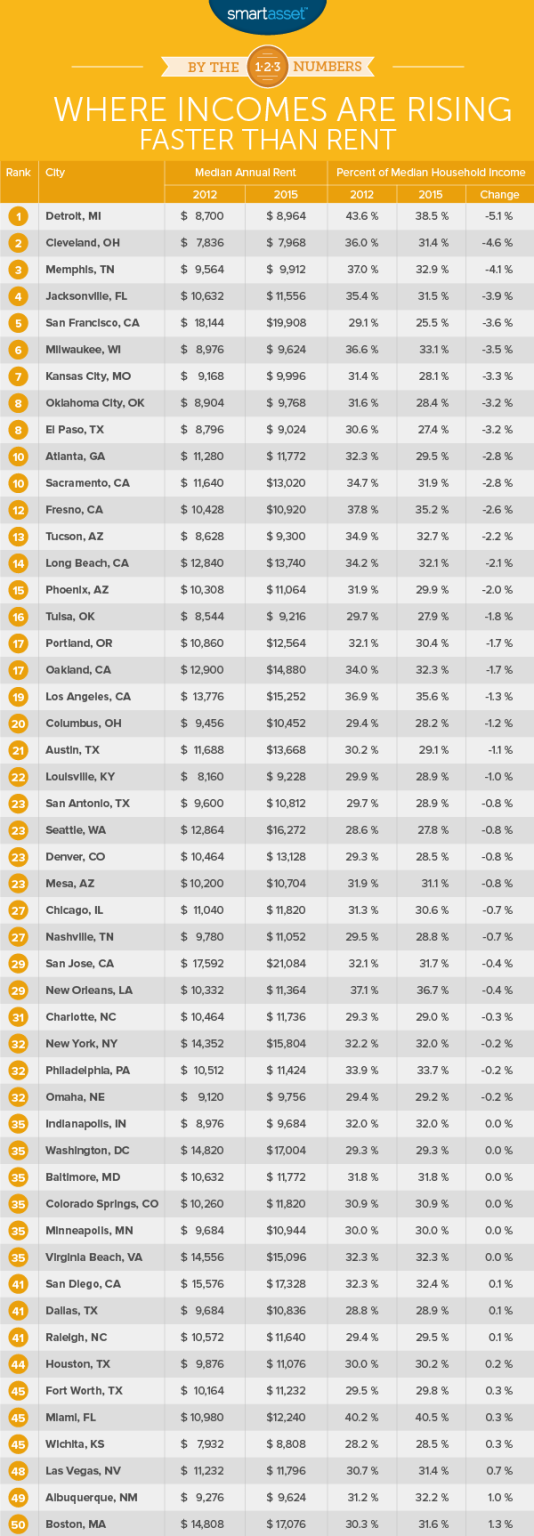
- The rent is too high – The U.S. Census Bureau designates anyone who spends 30% or more of their income on housing as rent-burdened. Our data shows that in 29 of the 50 largest cities, residents can expect to pay 30% or more of their incomes on rent.
- Rebounding Midwest – Midwest cities like Detroit, Cleveland and Milwaukee are well represented in the top 10. These cities rank first, second and sixth, respectively, in our study.
- Demand is high in Miami – Residents of Miami (excluding Miami Beach) spent around 40% of their income on rent in both 2012 and 2015. This is far and away the highest percentage in our study. When did this start? According to Census data, between 2005 and 2006, Miami residents went from spending a relatively high 34% of their income on rent to an abnormally high 39%. That’s stayed the same ever since.
- Population changes – Places where there have been population declines have seen rents grow slower than places with a population increase.
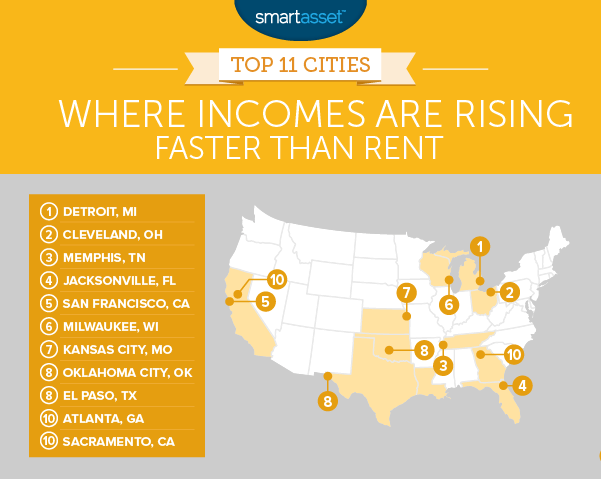
1. Detroit, MI
Detroit’s population has declined from a high of 1.8 million in 1950 to around 680,000 today. This has put downward pressure on the demand for housing which may explain why average rent costs only increased 3%, from $8,700 per year in 2012 to $8,964 in 2015. Our data shows that renters in the Motor City paid 5.1% less of their income on rent in 2015 than they did in 2012, the largest decrease in the country.
2. Cleveland, OH
The situation is Cleveland mirrors the situation in Detroit. Cleveland’s population peaked in 1949 then the manufacturing industry slowed and people began leaving. Today the population is mostly flat and rents have responded by only increasing by 1.7%. Our data shows that median annual household incomes rose around 18%, from $24,257 in 2012 to $28,831 in 2015.
3. Memphis, TN
The population in Memphis is currently growing, but remains at a net loss from its high of 690,000 in 2000. The average rent in Memphis rose by 3.64% from 2012 to 2015. In 2012, the average annual rent was $9,564 and in 2015, it was $9,912. However, this was offset by an increase of around 10% in median income. Memphis households took home $33,563 on average in 2012 and $36,908 on average in 2015.
Related Article: America’s Most Affordable Travel Destinations
4. Jacksonville, FL
This is the first city in the top 10 with a significant rent increase. From 2012 to 2015, rents in Jacksonville went from an average of $10,632 per year to $11,556 per year – an increase of 8.7%. Fortunately for the people living in Jacksonville this is not as high as the increase in incomes. Residents saw incomes rise 12.7% on average over the same period.
5. San Francisco, CA
San Franciscans pay the second-highest annual rent in the country – almost $20,000 a year on average. But many of the incomes there are also very high, particularly in the STEM professions. Some STEM jobs in SF pay almost $98,000 on average. The percent of income dedicated to paying rent in San Francisco decreased from 29.1% to 25.5% over the time period we analyzed. That 25.5% figure is one of the lowest in the country. While a relatively low percentage of income dedicated to paying rent may sound like a good thing, the data should be understood in context. The numbers suggest that San Francisco is largely unaffordable for people who don’t make the (very) big bucks.
6. Milwaukee, WI
Like Detroit and Cleveland, Milwaukee’s heyday was in the mid-20th century. The population peaked at 741,324 in 1960 and today sits at around 600,000. Despite the similarities with Cleveland and Detroit, the situation in Milwaukee is slightly rosier. Average incomes rose around 10% from 2012 to 2015 and rents only increased by 7.2%. However there is room for improvement. In 2015, the average renter was considered rent-burdened, as data shows they spend 33% of their income on rent.
7. Kansas City, MO
The average Kansas City renter can celebrate the fact that they’re no longer considered rent-burdened. In 2012, they went from spending around 31% of their income on rent on average to only 28% in 2015. This was led mostly by an increase in incomes rather than slow rental cost growth. From 2012 to 2015, Kansas City households saw annual incomes rise from $41,877 to $50,259 on average. Annual rents increased from $9,168 to $9,996 on average for that same time period.
8. (tie) Oklahoma City, OK
Like its neighbors in Missouri, residents of Oklahoma City are no longer rent-burdened. They went from spending 31.6% of their income on rent down to 28.4%, which is good enough for the eighth-highest drop in income spent on rent. Average incomes in OKC increased by 17% over the same time period.
8. (tie) El Paso, TX
El Paso saw rents increase by only 2.59% over the 2012-2015 time period, the second-lowest in our study. Unlike other cities with relatively low increases in rent costs, El Paso has not been struggling in the recent past. Renters there paid 30.6% of their income on rent in 2012 and 27.4% of their income on rent in 2015, which is second only to San Francisco for least rent-burdened.
10. (tie) Atlanta, GA
Atlanta is known for its urban sprawl so it makes sense that rents have remained relatively flat from 2012 to 2015. Average rent costs increased by about 4.3%. The economic situation in Atlanta seems to be trending up as annual household incomes rose from $46,466 to $50,210 on average.
Heading to Atlanta? Here are 15 things you need to know.
10. (tie) Sacramento, CA
Sacramento is tied with Atlanta at a 2.8% decrease in the percentage of income which goes to paying rent. Unlike Atlanta, rents in Sacramento are actually rising pretty fast. From 2012 to 2015, average rents went up 11.86%. However those rent increases were matched with high increases in average annual incomes. Sacramento households made an average of $52,151 in 2015 which is 7.43% more than in 2012.
Data and Methodology
In order to determine the top cities where incomes are rising faster than rents, SmartAsset looked at the U.S. Census Bureau’s gross annual median rent data and annual median household income data for 2012 and 2015 for the 50 largest cities.
We looked at the percent of income which goes to rent in 2012 and compared it to the percent of income which goes to rent in 2015. We then ranked the cities from highest to lowest in where the percent of income going to rent dropped the most.
Questions about our study? Contact us at press@smartasset.com.
Photo Credit: ©iStock.com/feverpitches