 Written by
In 2016 at 56 million strong, millennials became the largest generation in the U.S. labor force, according to Pew Research. This means that millennials make up more than a third (35%) of labor force participants in the U.S. Their success as young professionals can have an outsize effect on their finances throughout their lives. Having a steady income is one way to be able to afford a home as well as begin saving for retirement.
Given the large number of millennials already in or looking to join the labor force, we uncovered the best cities in the U.S. for younger workers. In total, we considered nine metrics that encompass both economic and livability factors relevant to young professionals. More specifically, they consider cost of living, entertainment, job diversity and income, along with the unemployment rate for those between 25 and 34. For details on our data sources and how we put it together to create our final rankings, see our Data and Methodology section below.
This is SmartAsset’s third annual study on the best cities for young professionals. Check out the 2018 version of the study here.
Key Findings
- A jump for Denver and Nashville. In our 2018 study, Denver, Colorado ranked 25th, and Nashville, Tennessee tied for 20th with Portland, Oregon. In 2019, both cities jumped up significantly due to improved economic metrics, tying for third.
- No Northeast. In last year’s study, Pittsburgh, Pennsylvania ranked fourth and Jersey City, New Jersey was in the top 20. This year, there are no cities located in the Northeast in our top 20, 30 or even 40 cities. In fact, according to Census regional divisions the first Northeast city to appear on our list is Boston, Massachusetts, ranking 42nd.
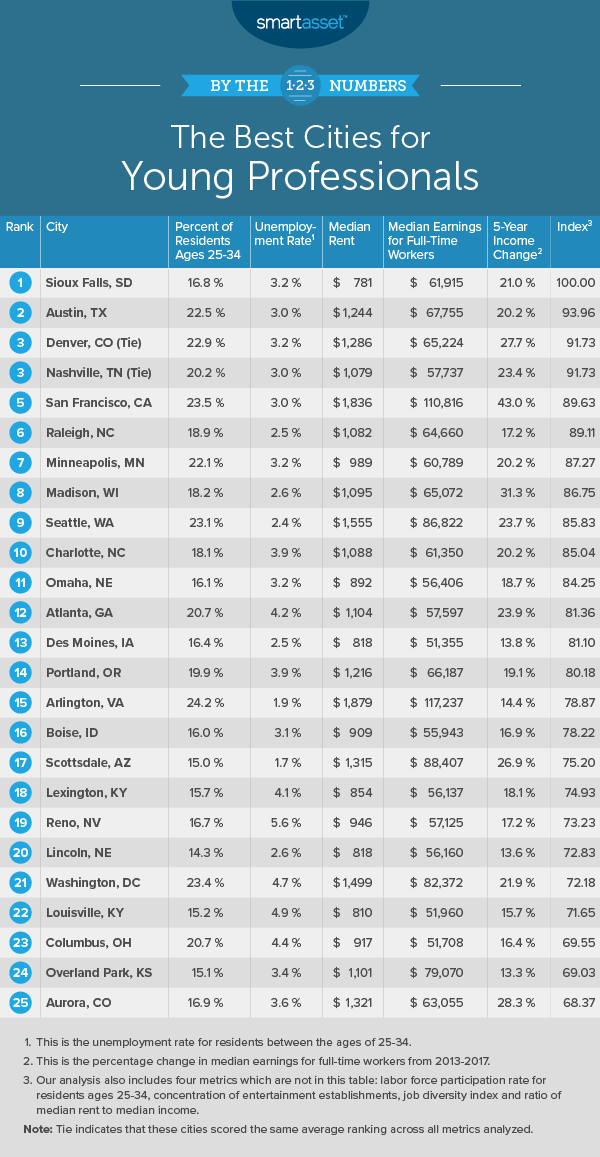
- Rent, rent, rent. Rent continues to be a big expense for city dwellers. The average median rent across all cities in 2017 was more than $1,100 a month. Median rent in 2017 made up almost a quarter of median earnings on average across all cities in our study.
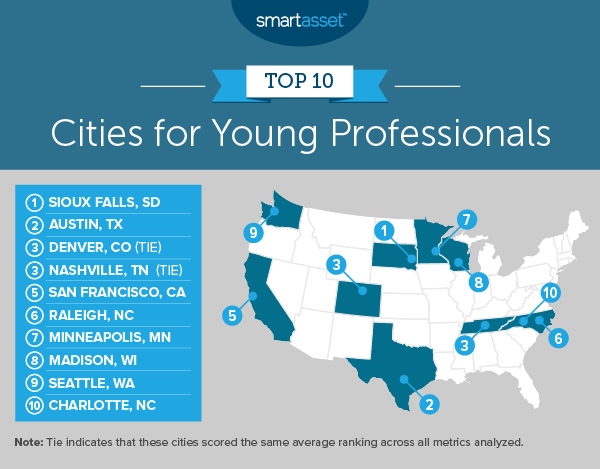
1. Sioux Falls, SD
For the third year in a row, Sioux Falls, South Dakota ranks first as the best city for young professionals. Sioux Falls ranks in the top 40% of cities across all but one metric. Perhaps Sioux Falls’ biggest selling point is that it is incredibly affordable. The median gross rent in 2017 was below $800 a month. In comparison, average median rent across all cities in 2017 was about $1,109 a month. Additionally, median earnings significantly outpace median rent. In Sioux Falls, median rent as a percentage of household earnings was only 15.14% in 2017 compared to an average of 23.43% for all cities.
The one metric for which Sioux Falls does not fall in the top 40% of cities is job diversity. Measuring job diversity using the Shannon index, a commonly used diversity index, Sioux Falls ranked 85th of the 150 cities in that metric. Jobs in Sioux Falls are concentrated in retail trade, educational services and healthcare and social assistance.
2. Austin, TX
Austin, Texas has a high percentage of young people. According to Census Bureau estimates, almost one-fourth of the population – specifically 22.52% – was between the ages of 25 and 34 in 2017. Moreover, there is a low unemployment rate and high labor force participation for this part of the population. In 2017, the unemployment rate for workers between 25 and 34 was 3.0% and the labor force participation rate was 88.30%.
The metric for which Austin does the worst is median gross rent, ranking 110th. According to Census Bureau estimates, median gross rent in 2017 was $1,244, more than average rent for all cities by $135. However, in general, residents in Austin are earning enough to afford higher rent prices. In 2017, median earnings were $67,755 meaning that residents were spending 22.03% of their pre-tax income on rent, which is below average.
3. Denver, CO (tie)
Denver, Colorado ties for third with Nashville, Tennessee. Similar to Austin, almost 23% of the population in Denver falls between the ages of 25 and 34 and 89.36% of them are employed. Additionally, young professionals moving to Denver have lot of options in terms of industry. Job diversity in Denver is the highest of any city in our top 10. Across all cities in our study, Denver ranks 20th for job diversity.
Like Austin, rent in Denver is relatively high, though. In 2017, median gross rent was $1,286 per month, meaning that the annual median rent for Denver residents is about $15,500.
3. Nashville, TN (tie)
As previously noted, Nashville, Tennessee – tied with Denver, Colorado for third place – saw a big move up in rankings from our 2018 study when it ranked 20th. The 17-rank rise was largely a result of a jump in median earnings and a subsequent increase in the five-year change in earnings. Census Bureau data shows that between 2016 and 2017, median earnings in Nashville increased by almost $16,000. Moreover, the five-year change in earnings from 2013 to 2017 is 23.36%.
Nashville can also be a fun city for young professionals. According to data from the Census Bureau’s 2016 County Business Patterns Survey, 4.35% of businesses were dedicated to entertainment, more than double the average across all cities in our study.
5. San Francisco, CA
Widely known as one of the most expensive cities in the U.S., San Francisco, California is still a great option for young professionals who can afford it. There are a significant number of young people who live and work there. In 2017, 23.46% of the population was between the ages of 25 and 34, and the labor force participation was 91.14% for that age group. Employment options in San Francisco are more homogenous than in most other cities. Many jobs in San Francisco are concentrated in the technology industry, and using the Shannon index we found that San Francisco ranks 129th for job diversity of the 150 cities in our study.
6. Raleigh, NC
Ranking second last year, Raleigh, North Carolina fell to sixth in 2019. Earnings and earnings growth remain relatively high in Raleigh compared to last year’s findings using 2016 data. Median income in 2017 was $64,660, more than $6,000 above the national average median income. Moreover, from 2013 to 2017, earnings grew by more than 17%. In comparison, the average earnings growth from 2013 to 2017 for all cities considered in our study was about 15%.
Raleigh falls short compared to other cities in our top 10 in terms of entertainment establishment density. For entertainment establishment density, it ranks 47th overall, with only 1.56% of businesses dedicated to entertainment in 2016.
7. Minneapolis, MN
Also ranking seventh last year, Minneapolis, Minnesota offers young professionals relatively low rent and relatively high average annual incomes. The city ranks in the top half of the study for both of these metrics. The ratio of median gross rent to median earnings in 2017 was 19.52%, meaning that Minneapolis ranks 23rd on this metric relative to the other cities in our study. With a lower percentage of income going toward rent, young professionals may have more cash to save in a retirement account.
Last year, we cited a high unemployment rate for young professionals in Minneapolis as a concern. The unemployment for young professionals has significantly decreased from last year’s study. Census Bureau data from 2016 showed an unemployment rate of 5.7% for residents between the ages of 25 and 34. In 2017, the unemployment rate for the same population was 3.2%, a decrease of 2.5%.
8. Madison, WI
Our top least-stressed city in 2019, Madison, Wisconsin is very competitive economically. Young professionals in Madison are largely employed. The unemployment rate for residents between the ages of 25 and 34 was 2.6% in 2017 (a top-15 rate) and 89.36% of the same population was participating in the labor force (a top-10 rate). The city’s five-year change in earnings is 31.34%, which is the fourth-highest rate for this metric in the entire study. Notably, Madison has a less diverse job market than many other cities, ranking 142nd out of the 150 cities in our study.
9. Seattle, WA
Seattle, Washington has very strong employment numbers for full-time workers between the ages of 25 and 34. According to Census Bureau estimates, in 2017, the labor force participation rate was greater than 91% – the third-highest rate for this metric overall – and the unemployment rate was 2.4% for the population between ages 25 and 34 – the sixth-highest rate for this metric overall. Moreover, earnings are relatively high as well. The median annual household income in 2017 was $86,822, a top-15 rate.
The Emerald City has high median earnings, but it’s also expensive. In 2017, median gross rent was more than $1,500 per month, which is the second-highest median gross rent of any city in our top 10 – behind only that of San Francisco.
10. Charlotte, NC
Rounding out our list, Charlotte, North Carolina ranks in the top third of cities for all but one of the nine metrics we considered. In 2017, 18.07% of the population was between the ages of 25 and 34 and for that population the unemployment rate was 3.9% and labor force participation rate was 87.61%. The median annual income for residents was $61,350. The one metric Charlotte falls short on is rent, ranking 90th. The median gross rent was $1,088 in 2017.
Data and Methodology
To rank the best cities for young professionals, we looked at data for the 150 largest cities in the U.S. Specifically, we compared cities over the following nine metrics:
- Percentage of the population between ages 25 and 34. Data comes from the Census Bureau’s 2017 1-year American Community Survey.
- Unemployment rate for young professionals. This is the unemployment rate for residents ages 25 to 34. Data comes from the Census Bureau’s 2017 1-year American Community Survey.
- Labor force participation rate for young professionals. This is the labor force participation rate for residents ages 25 to 34. Data comes from the Census Bureau’s 2017 1-year American Community Survey.
- Median gross rent. Data comes from the Census Bureau’s 2017 1-year American Community Survey.
- Entertainment establishment density. This is the percentage of all establishments in the area dedicated to arts, entertainment or recreation. Data comes from the Census Bureau’s 2016 County Business Patterns Survey.
- Job diversity. This measures the variety of industries available in a city. We used the Shannon index to calculate this figure. A higher number indicates a more diverse job market. Data comes from the Census Bureau’s 2017 1-year American Community Survey.
- Median household earnings. Data comes from the Census Bureau’s 2017 1-year American Community Survey.
- Five-year change in median household earnings. This is the percentage change in median household earnings from 2013 to 2017. Data comes from the Census Bureau’s 2017 and 2013 1-year American Community Surveys.
- Median rent as a percentage of household earnings. Data comes from the Census Bureau’s 2017 1-year American Community Survey.
First, we ranked each city in every metric, weighting all metrics equally. Then we found each city’s average ranking and used the average to determine a final score. The city with the highest average ranking received a score of 100. The city with the lowest average ranking received a score of 0.
Tips for Young Professionals
- Young professionals can often benefit from the help of a financial advisor. Finding the right financial advisor that fits your needs doesn’t have to be hard. SmartAsset’s free tool matches you with financial advisors in your area in 5 minutes. If you’re ready to be matched with local advisors that will help you achieve your financial goals, get started now.
Questions about our study? Contact us at press@smartasset.com
Photo credit: ©iStock.com/jacoblund