 Written by
It’s no secret that the U.S. is absolutely dog crazy. According to an American Pet Products Association survey of pet owners from 2019-2020, more than half of all American households, or 63.4 million homes, had dogs. When it comes to taking care of their pooches, Americans spend an average of $1,200 per year on Fido, a recent survey found. While the expenses can certainly add up, where you live can make your canine’s companionship that much more enjoyable – not to mention easier. With that in mind, SmartAsset analyzed data to identify and rank the most dog-friendly cities in the country.
We analyzed data for 100 of the largest U.S. cities across the following seven metrics: dog parks per 100,000 residents, dog-friendly restaurants, dog-friendly shopping centers, median home value, average annual days of precipitation, the walkability of a city and concentration of pet stores and veterinary offices. For details on our data sources and how we put all the information together to create our final rankings, read the Data and Methodology section below.
This is the 2021 version of SmartAsset’s study on the most dog-friendly cities. Read the 2020 version here.
Key Findings
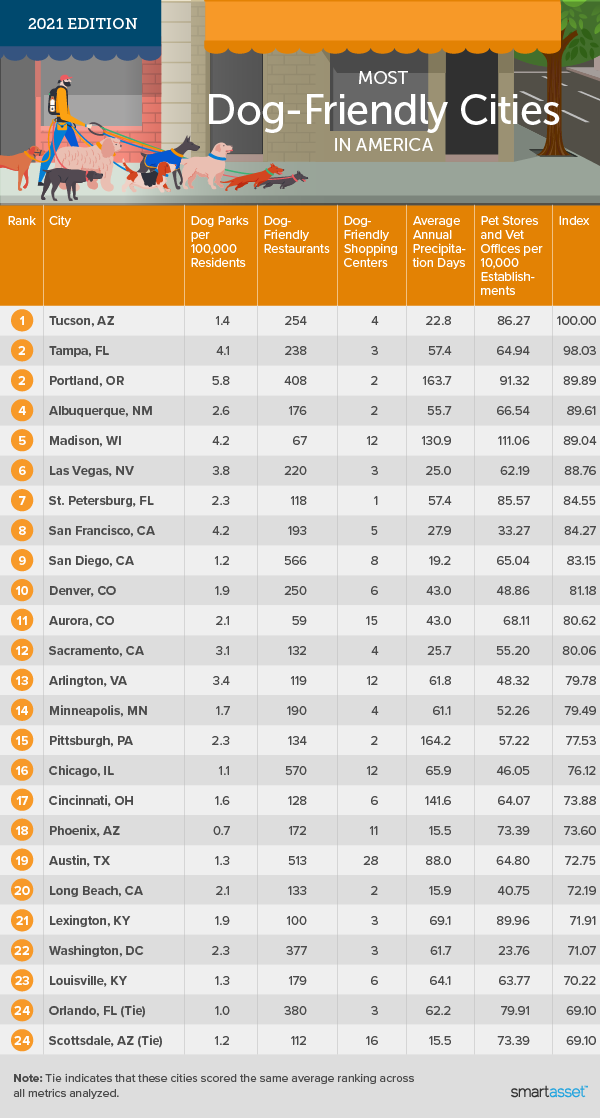
- Tucson still has dogs wagging their tails. Tucson, Arizona is the No. 1 dog-friendly city in the country for the second year in a row. A high concentration of pet stores and vet offices, paired with sunny weather and affordable homes, makes Tucson a great place to care for a dog.
- Cities with the most dog parks are located in Western states. The top five cities in the study with the most dog parks include four in Western states. Boise, Idaho has the most dog parks per 100,000 residents (6.3), followed by Portland, Oregon (5.8) and Henderson, Nevada (5.1). San Francisco, California (4.2) ties for fourth-highest spot for this metric. Overall, the 100 cities in our study have an average of 1.5 dog parks per 100,000 residents.
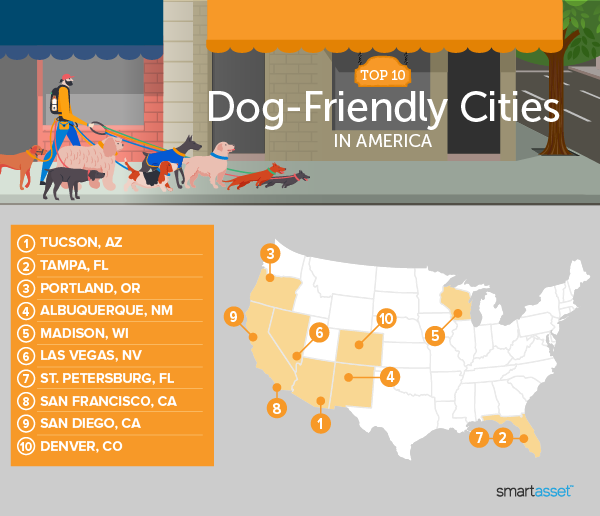
1. Tucson, AZ
Tucson, Arizona has the fifth-highest number of pet stores and vet offices for every 10,000 establishments across our entire study. The city also ranks in the top 20 for both dog-friendly restaurants (254) and days of precipitation per year (22.8). Tucson also ranks within the top 40 for dog parks per 100,000 residents (1.4).
2. Tampa, FL
With the sixth-highest number of dog parks for every 100,000 residents (4.1), Tampa, Florida is next on our list. The city also has the 18th-highest number of dog-friendly restaurants across our study (238). Tampa ranks among the top 35 cities for walkability, as well as pet stores and vet offices per 10,000 establishments.
3. Portland, OR
Portland, Oregon has more dog parks for every 100,000 residents (5.8) than any other city in our study except Boise, Idaho. The Rose City also ranks third for number of pet stores and vet offices per 10,000 establishments (91.32) and seventh for number of dog-friendly restaurants (408). Meanwhile, Portland has the 18th-best walk score across this study.
4. Albuquerque, NM
Albuquerque, New Mexico ranks 13th-best for number of dog parks per 100,000 residents (2.6) and 28th-best for number of dog-friendly restaurants (176). Albuquerque is also in the top half of cities for its concentration of pet stores and vet offices (more than 66 for every 10,000 establishments), days of precipitation per year (less than 56) and median home value ($211,800).
5. Madison, WI
Coming in at No. 5, Madison, Wisconsin has the highest concentration of pet stores and vet offices in our study (more than 111 for every 10,000 establishments) and is tied for having the fourth-highest number of dog parks per 100,000 residents, at 4.2. While Madison ranks 91st out of all 100 cities for number of days with precipitation (130.9 per year), the city has the ninth-highest number of dog-friendly shopping centers overall (12).
6. Las Vegas, NV
Known as “America’s Playground,” Las Vegas, Nevada has the seventh-highest number of dog parks per 100,000 residents, making it a great place for dogs to play, too. Vegas ranks 17th-best for relatively few days of precipitation (25 per year) and 21st-best for number of dog-friendly restaurants (220).
7. St. Petersburg, FL
Like its larger neighbor Tampa, just across the bay, St. Petersburg, Florida ranks within the top 20 for its relatively high number of dog parks per 100,000 residents (2.3). The city also has a relatively high concentration of pet stores and vet offices (more than 85 for every 10,000 establishments), sixth-highest across all 100 cities in the study.
8. San Francisco, CA
San Francisco, California may have the highest median home value of all 100 cities in our study ($1.2 million), but it’s also the second-most walkable city and tied for having the fourth-highest number of dog parks per 100,000 residents (4.2). San Francisco also ranks in the top 25% of our study for relatively few days of precipitation (less than 28 per year) and number of dog-friendly restaurants (193).
9. San Diego, CA
With 566 dog-friendly restaurants, San Diego, California ranks second only to Chicago, Illinois for this metric. It’s also no surprise that sunny San Diego ranks highly for its weather, with only approximately 19 days of precipitation per year (the 14th-fewest overall). This Southern California city is also in the top 20 for number of dog-friendly shopping centers, with eight.
10. Denver, CO
Denver, Colorado, which ranked No. 13 in last year’s study, fetches the No. 10 spot this time around. This city ranks in the top third of our study for dog parks per 100,000 residents (1.9), walkability, dog-friendly restaurants (250), dog-friendly shopping centers (six) and days of precipitation per year (43.0).
Data and Methodology
To find the most dog-friendly cities, SmartAsset pulled data for 100 of the largest cities in America. We compared the dog-friendliness of cities across the following seven metrics:
- Dog parks per 100,000 residents. This metric looks at the number of dog parks per 100,000 residents. Data comes from the Trust for Public Land’s 2021 Amenities and Facilities Report.
- Dog-friendly restaurants. This is the number of restaurants that allow dogs in outdoor seating areas. Data comes from BringFido.com and was pulled in July 2021.
- Dog-friendly shopping centers. This is the number of shopping centers that allow dogs. Data comes from BringFido.com and was pulled in July 2021.
- Median home value. Data comes from the Census Bureau’s 2019 1-year American Community Survey.
- Walk score. This factor measures the walkability of each city. Data comes from Walkscore.com’s 2020 City and Neighborhood Ranking.
- Days of precipitation. This is the average number of days with precipitation per year. Data comes from the National Oceanic and Atmospheric Administration and represents 20-year averages from 2001-2020.
- Concentration of pet stores and veterinary offices. This is the number of pet stores and veterinary offices per 10,000 establishments in the county. Data comes from the County Business Patterns Survey and is for 2019.
We ranked each city in each metric, double weighting dog parks per 100,000 residents and single weighting all other metrics. We then found each city’s average ranking using the above weights for each metric. The city with the best average ranking received a score of 100. The city with the worst average ranking received a score of 0.
Tips for Pet Parents to Stay on Budget
- Know your numbers. Do you struggle with creating a budget that you can actually follow? Do you find yourself splurging on your pet’s toys but coming up short on other essentials and savings? Try SmartAsset’s budget calculator to develop a plan that takes into account a variety of areas of our spending, from housing and transportation to pet care and the all important category of personal savings. Knowing how much you spend in each area is the first step to creating an actionable budget.
- Work with an expert. A financial advisor can help you create a financial plan to reach your needs and goals. SmartAsset can match you with up to three advisors in your area in just a few minutes. If you’re ready to find a financial advisor, get started now.
Questions about our study? Contact press@smartasset.com.
Photo credit: ©iStock.com/max-kegfire