 Written by
According to the American Pet Products Association, Americans spent $95.7 billion on their pets in 2019, with almost $37 billion going toward pet food and treats alone. Given that dogs are among the most popular pets in the U.S., it’s probably no surprise for current or prospective pup parents that creating space in one’s home – as well as one’s wallet – is essential to helping these pooches maintain a healthy lifestyle. It’s not equally easy in every city, though. That’s why SmartAsset decided to find the ones that are the most dog-friendly.
To conduct our study, we analyzed data for 100 of the largest U.S. cities across the following seven metrics: dog parks per 100,000 residents, dog-friendly restaurants, dog-friendly shopping centers, median home value, average annual days of precipitation, walk score and concentration of pet stores and veterinary offices. For details on our data sources and how we put all the information together to create our final rankings, check out the Data and Methodology section below.
This is the 2020 version of SmartAsset’s study on the most dog-friendly cities. Read the 2019 version here.
Key Findings
- Western states form a strong pack. Six of the top 11 cities in the study are in Western states. Representing Arizona, Nevada, New Mexico, Oregon and California, all of these cities rank within the top half of the study for number of dog parks per 100,000 residents, approximately within the top quarter of the study for number of dog-friendly restaurants and within the top 40 of the study for number of dog-friendly shopping centers.
- Finding a vet or a pet store shouldn’t be…ruff. The average number of pet stores and veterinary offices across all 100 cities in the study is approximately 57 per 10,000 establishments. All but two cities in our top 11 (Minneapolis, Minnesota and San Francisco, California) rank above average in this metric, ensuring lots of options for pet parents to fetch their dog’s day-to-day and medical needs, from check-ups and flea treatments to kibble and the occasional chew toy.
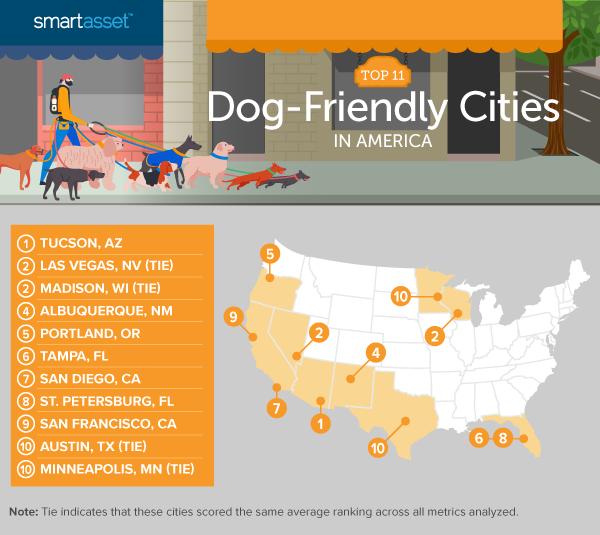
1. Tucson, AZ
Tucson, Arizona ranks within the top 15 of the study for three of the seven metrics we considered: a relatively high number of dog-friendly restaurants (251) and concentration of pet stores and vet offices (more than 86 for every 10,000 establishments) as well as a low number of days with precipitation (less than 23 per year on average). Furthermore, the city ranks within approximately the top third of the study for its 1.4 dog parks per 100,000 residents. The median home value in Tucson is $167,800, the lowest in the top 11 and 26th-lowest overall.
2. Las Vegas, NV (tie)
Las Vegas, Nevada ties with Madison, Wisconsin for our No. 2 spot. While the city ranks in the bottom half of the study for median home value and walk score, it has the seventh-highest ratio of dog parks to residents across all 100 cities in our study. It also has the second-best rate in the study for average annual days of precipitation, at fewer than 15 per year.
2. Madison, WI (tie)
Madison, Wisconsin ties with Las Vegas, Nevada for No. 2 in our study. It ranks in the top 10 of the study for three metrics. Madison has the 10th-highest number of dog parks compared to residents in the study, at approximately three per 100,000 residents. It has fourth-highest number of dog-friendly shopping centers, at 12. Finally, it has the highest concentration of pet stores and vet offices, at roughly 111 per every 10,000 establishments. Beyond all this, Madison is a highly walkable city, with lots of potential to take your furry friend on those strolls they love.
4. Albuquerque, NM
Albuquerque, New Mexico ranks within the top 20 for two of the seven metrics we considered, with the 14th-highest ratio of dog parks to residents, at 2.4 per 100,000 residents, and the 19th-lowest days of precipitation in the study, at an average of 28.0 per year). The city has 181 restaurants that are dog-friendly, ranking 26th-highest for this metric. Furthermore, Albuquerque ranks within the top 40 of the study for its relatively high concentration of pet stores and vet offices, at more than 63 per 10,000 establishments, and its relatively low median home value, at $207,300.
5. Portland, OR
Portland, Oregon takes the No. 5 spot and is the only city in the Pacific Northwest to bark up our Top 11 tree. The city has 5.8 dog parks per 100,000 residents, the second-highest rate in our study. Additionally, Portland has the sixth-highest concentration of pet stores and vet offices, at approximately 85 per 10,000 establishments, and the seventh-highest number of dog-friendly restaurants, at 407.
6. Tampa, FL
Tampa, Florida has the sixth-highest number of dog parks per 100,000 residents, at 3.9, across all 100 cities in our study. While it ranks in the middle of our study for median home value, at $257,600, it claims a top-20 ranking for its number of dog-friendly restaurants, at 226, and top-40 rankings for walk score, number of dog-friendly shopping centers and concentration of pet stores and vet offices.
7. San Diego, CA
San Diego, California’s pups are in for lots of treats, as the city has the second-highest number of dog-friendly restaurants in the study – and the highest number in the top 11 – at 555. The city ranks within the top half of the study for all other metrics except for median home value, performing particularly well for its number of dog-friendly shopping centers (10th-highest overall, at eight) and low number of average annual days of precipitation (20th-lowest overall, at 28.1).
8. St. Petersburg, FL
St. Petersburg, Florida has the seventh-highest concentration of pet stores and veterinary offices in the study, at approximately 79 per 10,000 establishments. It has the 15th-highest ratio of dog parks to residents, at 2.3 per 100,000 residents. Additionally, the city ranks within the top half of the study for three other metrics: median home value, walk score and dog-friendly restaurants.
9. San Francisco, CA
San Francisco, California has top-five rates for number of dog parks per 100,000 residents, at 4.1, and walk score, at 87. While it ranks in the bottom 10 of the study for median home value and concentration of pet stores and veterinary offices, the city ranks within the top fourth of the study for two other metrics: its relatively high numbers of dog-friendly restaurants and shopping centers, at 185 and five, respectively.
10. Austin, TX (tie)
Austin, Texas ties with Minneapolis, Minnesota as the No. 10 dog-friendly city. It ranks first and fifth, respectively, for its high numbers of dog-friendly shopping centers (28) and restaurants (495), allowing canine companionship in more of the places people frequent. Austin ranks 31st-highest in the study for concentration of pet stores and vet offices, at approximately 65 per 10,000 establishments. Furthermore, it has 1.3 dog parks per 100,000 residents, ranking 37th-highest.
10. Minneapolis, MN (tie)
Minneapolis, Minnesota ties with Austin, Texas for the No. 10 spot in our study. It ranks within the top 25 for three metrics: walk score (71), number of dog-friendly shopping centers (four) and number of dog-friendly restaurants (189).

Data and Methodology
To find the most dog-friendly cities, SmartAsset pulled data for the 100 of the largest cities in America. We compared the dog-friendliness of cities across the following seven metrics:
- Dog parks per 100,000 residents. Data comes from the Trust for Public Land’s 2020 Amenities and Facilities Report.
- Dog-friendly restaurants. This is the number of restaurants that allow dogs in outdoor seating areas. Data comes from BringFido.com and was pulled in July 2020.
- Dog-friendly shopping centers. This is the number of shopping centers that allow dogs. Data comes from BringFido.com and was pulled in July 2020.
- Median home value. Data comes from the Census Bureau’s 2018 1-year American Community Survey.
- Average annual days of precipitation. Data comes from currentresults.com.
- Walk score. This factor measures the walkability of each city. Data comes from Walkscore.com’s 2020 City and Neighborhood Ranking.
- Concentration of pet stores and veterinary offices. This is the number of pet stores and veterinary offices per 10,000 establishments in the county. Data comes from the County Business Patterns Survey and is for 2018.
We ranked each city in every metric, single weighting all metrics except for dog parks per 100,000 residents which was double weighted. We then found each city’s average ranking. The city with the best average ranking received a score of 100. The city with the worst average ranking received a score of 0.
Tips for Pet-Friendly Spending
- Take hold of your budget. Those unexpected veterinarian visits and chew toys can add up. Make sure you have enough wiggle room in your budget for a surprise expense – whether it’s a trip to the doctor or a shiny new toy. Use our free budget calculator to reassess your budget.
- Carefully decide whether to buy or rent. Need more space for you and your growing family, pets and all? You may not be entirely ready to buy – check out our Rent vs. Buy tool to help you make your decision.
- Consider expert financial advice. Finding the right financial advisor doesn’t have to be hard. SmartAsset’s free tool matches you with financial advisors in your area in five minutes. If you’re ready to be matched with local advisors that will help you achieve your financial goals, get started now.
Questions about our study? Contact press@smartasset.com
Photo credit: ©iStock.com/valentinrussanov