 Written by
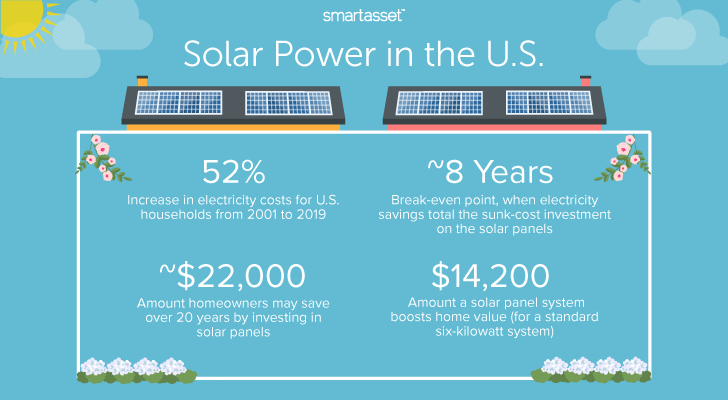
Monthly electric bills vary with the seasons. They are typically lower during milder spring and fall months and higher in the summer and winter, when households are running air conditioners or heaters. Despite these monthly variations, data from the U.S. Energy Information Administration (EIA) shows that the average American household spends about $1,400 on electricity per year. With many Americans now working from home, households may spend more on electricity in 2020 than ever before and need to adjust their savings as a result. Clean energy technology company Arcadia found that one-third of U.S. households spent between 10% and 15% more on their summer electricity this year compared to last year.
In light of increased home electricity usage and given that October is National Energy Awareness Month, SmartAsset decided to investigate the financial value of residential solar panels. We conducted a cost analysis of solar panels and studied data from the past two decades to investigate why it has become more favorable for homeowners to use them. Additionally, we considered how potential solar savings differ across states and researched alternatives to purchasing solar panels outright. For details on our data sources and how we put all the information together to create our findings, check out the Data and Methodology section below.
Key Findings
- Homeowners considering solar panels should act quickly. Solar panels have been made more affordable to individuals over the past 15 years under a federal tax credit that covers a percentage of their costs. Systems installed in 2020 will receive a 26% credit, and those added during 2021 will receive a 22% credit. Beginning in 2022, residential homes will no longer receive federal assistance for solar panel installations unless Congress renews the credit.
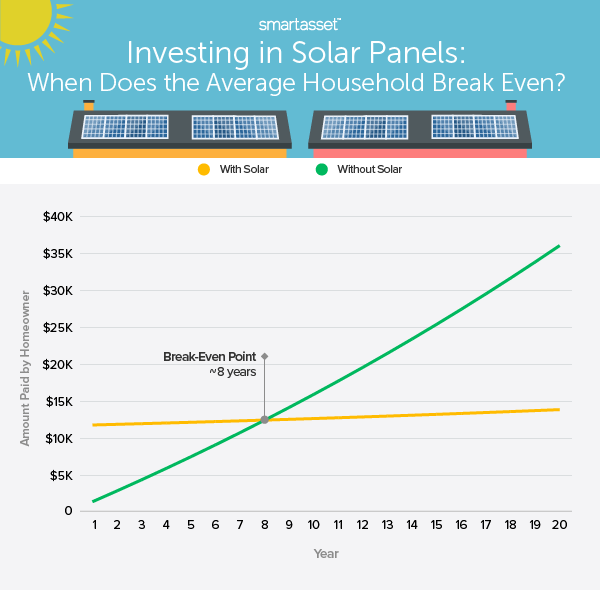
- The average American household can break even on a solar panel system in about eight years. Most residential solar installations cost between $10,000 and $15,000. According to SolarReviews, an average-sized solar installation for a home in the U.S. costs about $11,700 after the 26% federal tax credit. Though the significant upfront cost can be off-putting, most systems will pay for themselves in roughly eight years. At that point, residents will not only break even on their investment, but they will also start saving money since they will need to purchase minimal to no grid electricity.
- There are alternatives to buying solar panels outright. Purchasing a solar photovoltaic (PV) system is a significant upfront cash investment. Given the myriad expenses associated with homeownership, many people may not have the savings to dedicate towards purchasing panels outright. Two other options are solar loans and leases. Solar loans allow homeowners to own the panels and borrow money to cover the cost of installation. If customers enter a solar lease agreement, they themselves don’t have to pay any upfront costs for installation, but they also would not own the panels – a solar company would install and own the solar panel system and allow the household to use the power that the system creates in exchange for a monthly lease payment.
The Basics of Solar Panels and Residential Installation
Solar panel installation prices are measured per watt. The price per watt (PPW) is the gross system cost divided by the system size. In other words, it’s the price homeowners will pay for every watt of solar energy that they purchase.
Estimates of the average PPW for a residential solar system installation vary. According to Lawrence Berkeley Labs – a national laboratory funded by the Department of Energy – the national median installation price for a residential solar system in 2018 was $3.72 per watt, prior to the receipt of any incentives. EnergySage quotes a similar figure for 2020 of $3.93 per watt. Meanwhile, SolarReviews estimates the average installation price to be lower. In its recent report based on marketplace data, SolarReviews found the average residential solar panel system cost to be $2.64 per watt as of September 2020.
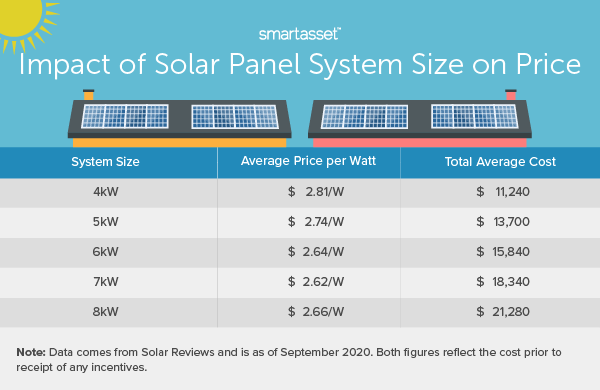
Despite variations in estimates of the national average PPW, solar panel installation prices generally follow an economies of scale price model. That is, the larger the system size, the lower the PPW. According to Lawrence Berkeley Labs, the median solar panel system size in the U.S. for homeowners is 6.4 kilowatts (i.e. 6,400 watts), though most residential systems may range anywhere from four to eight kilowatts. The table below shows price estimates from EnergySage – in both PPW and the total average cost – according to system size.
Cost of Solar Panels Over Time
Over the past two decades, the cost of solar panels in the U.S. has fallen. As previously noted, Lawrence Berkeley Labs quotes the national median installation price for residential solar systems in 2018 at $3.72 per watt. This is close to 70% lower than the national median installation price in 2000, $12.05 per watt. The chart below shows the median installation price for residential solar PV systems from 2000 to 2018, along with the 20th and 80th percentiles.
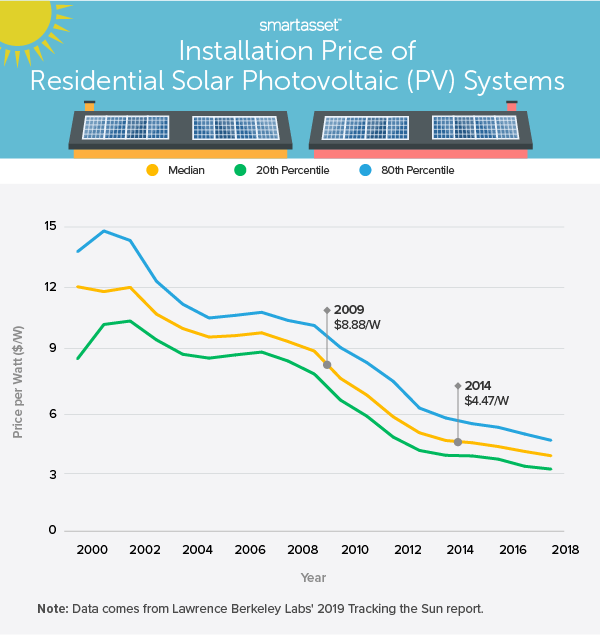
Seen above, the largest price dips occurred between 2009 and 2014. The national median installation price for residential solar systems fell by $1.36, or about 15%, from 2009 to 2010 alone. Over the full five-year period, the cost was essentially cut in half, from $8.88 per watt in 2009 to $4.47 in 2014.
It’s important to note that the above figures reflect installation prices prior to additional incentives. Various government policies push down the installation cost even further. Most notably, the federal tax credit for residential solar PVs – first enacted in 2005 under the Energy Policy Act – can be claimed on federal income taxes for a percentage of the cost of a solar PV system. The credit was originally set at 30% of the total installation price for residential customers. However, it is being phased out. Systems installed in 2020 will receive a 26% tax break, those installed in 2021 will receive a credit for 22% and after that, individuals will not receive federal aid unless the government decides to renew the program. Several states committed to renewable energy offer additional tax credits and rebates for solar power. You can find the most recent and comprehensive state and local solar incentives at the Database of State Incentives for Renewables and Efficiency (DSIRE) website.
How Much Do Solar Panels Save?
Given the falling cost of solar panels and a tax credit that will soon expire, we looked into how much an individual could save by investing in solar energy in 2020. Electricity usage figures are quoted in kilowatt-hours. EIA data shows that the average American household uses 914 kilowatt-hours of electricity per month, or 10,972 kilowatt-hours per year. The average price of electricity for residential customers was 13.06 cents per kilowatt-hour between August 2019 and July 2020. This means that a typical American household spends about $120 monthly and more than $1,400 annually on electricity.
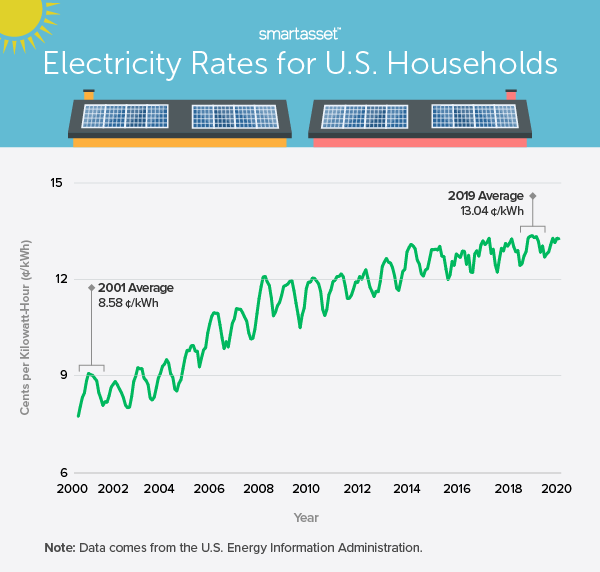
Just as the cost of solar panels has fallen, the average U.S. retail price of electricity for residential customers has increased. From 2001 to 2019, the average price of electricity for American households rose almost 52%, or at an annualized rate of 2.35%.
The chart below shows the upward trajectory of electricity rates for residential consumers over the past roughly 20 years. It’s important to note that the month-to-month fluctuations show how electricity prices are highest in the peak summer months of July and August.
By a conservative estimate, researchers believe that residential electricity rates will increase at a similar pace over the next 20 years, the logic being that as natural gas prices rise, electricity rates will also increase. This means that by 2040, the average American household will spend almost $190 per month and more than $2,200 per year on electricity. This amounts to roughly $36,000 on electricity over the next 20 years.
How does solar energy compare? As mentioned above, SolarReviews marketplace data shows that the average six-kilowatt residential solar panel installation costs $2.64 per watt. This means that the total system cost is about $15,800 prior to the federal tax credit, or roughly $11,700 after it is applied. According to EnergySage estimates, once a system is set up, solar panels meet 94% of household electricity needs on average – so it’s true that some homeowners might still have a remaining balance (depending on the size and orientation of their roof) even after the substantial preliminary cost. But on the whole, the switch to solar power saves them more in the long run. This is because solar-powered households will only pay for about 660 kilowatt-hours of electricity (of the total 10,972) per year. Additionally, solar panels may eliminate electricity bills entirely through a system called net metering, which allows consumers to produce more energy than they need now in order to use later (i.e. accrue utility bill credits during the summer months to offset winter energy use). Below we show the calculation comparison between grid electricity and solar power.
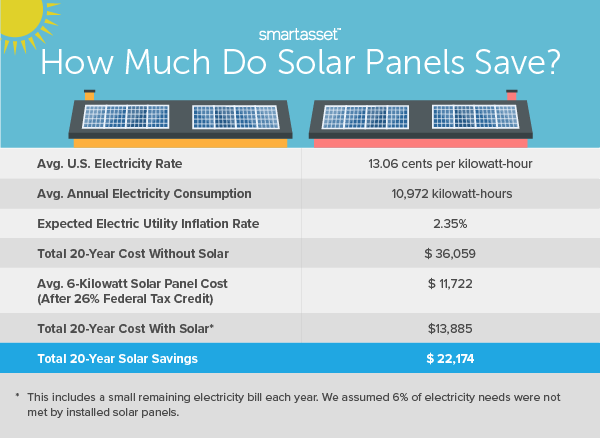
As seen above, we estimate that homeowners may save almost $22,200 over 20 years by investing in solar panels. These savings primarily kick in during the second half of that period. The below chart maps the spending of a household with grid electricity compared to one that invests in a solar PV system.
States Where Solar Power May Pay Off the Most
Because solar prices and electricity rates vary across states, transitioning to solar may allow residents to save more in some states over others. Of course, the biggest takeaway isn’t that certain states are better than others with regards to solar power and its pricing. EnergySage notes there is a “healthy trend of adoption across the states without direct correlation to lowest cost per watt” and many additional factors influence uptake rates. However, in general, residents stand to save the most in states where solar PV installation prices are low and electricity rates are high.
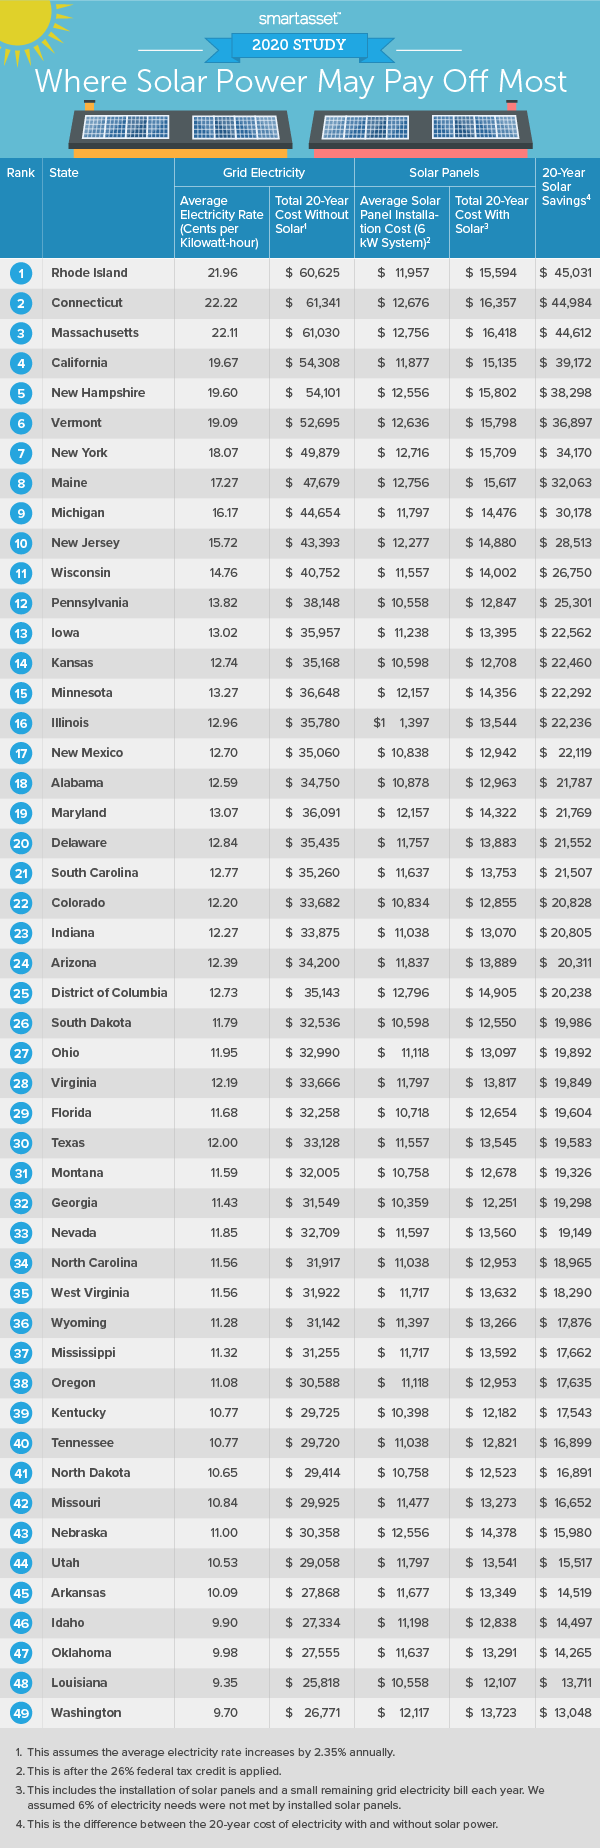
We calculated the 20-year savings for solar electricity for the 48 contiguous U.S. states and the District of Columbia. We did this by using the average residential electricity price for customers in each state between August 2019 and July 2020, as well as the average price of installation. Our estimates rely on several important assumptions, listed below:
- System size: six kilowatts (SolarReviews marketplace data)
- Electricity demand: 10,972 kilowatt-hours per year (EIA national average)
- Electric utility inflation rate: 2.35% (based on EIA data)
- Percentage of need met by solar panels: 94% (EnergySage marketplace average)
Using SolarReviews’ average solar PV installation price and EIA’s electricity rates in each state along with the above assumptions, we found the average total electricity bill over a 20-year period and the expected cost of solar electricity over the same time. The map below highlights the top 10 states where solar power may pay off the most.
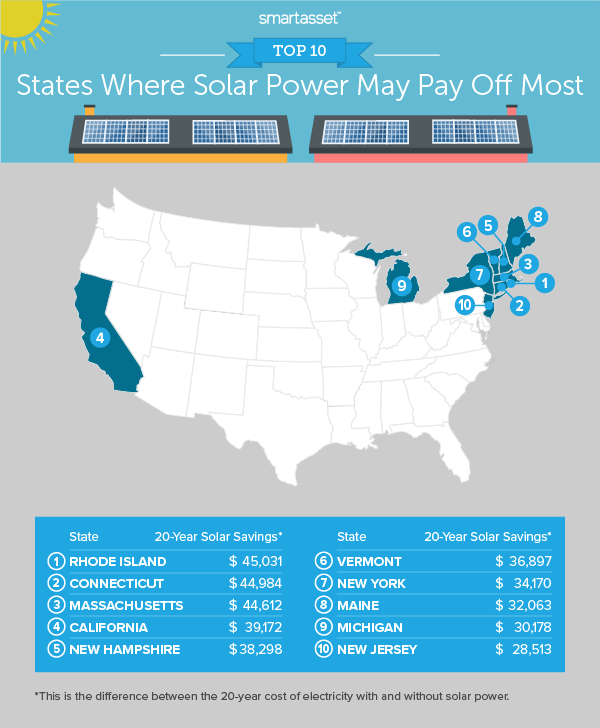
Rhode Island places at the top of the list. Between August 2019 and July 2020, the average retail price of electricity for residential customers was 21.96 cents per kilowatt-hour, almost one-and-a-half times the national average. Assuming this rate grows 2.35% annually, the average Rhode Island resident can expect to pay more than $60,600 in electricity over the next 20 years. In comparison, a six-kilowatt solar PV system in Rhode Island costs around $12,000 and additional electricity costs for the 6% of need not met by solar amount to less than $3,700 over the 20-year period.
Seven other Northeastern states rank in our top 10. They include Connecticut, Massachusetts, New Hampshire, Vermont, New York, Maine and New Jersey. In all seven states, average electricity prices are more than 30% higher than the national average and average solar installation prices for a six-kilowatt system are between $12,000 and $13,000 after the federal tax credit. The table below shows how all 48 contiguous states and the District of Columbia compare in terms of solar savings.
How Do Solar Panels Affect Property Values?
In general, solar panels have been shown to increase property values. Most notably, a 2015 study published by Lawrence Berkeley Labs analyzed sales of solar-equipped homes in eight different states over 11 years. It found that homebuyers were willing to pay more for homes with a solar PV system across a variety of states, housing markets and home types. Lawrence Berkeley Labs estimated that the premium was about $4 per watt of installed solar capacity, approximately 8% lower than the installation price per watt at the time of the study ($4.36). Assuming the premium is worth about 90% of the installation price per watt, a six-kilowatt system totaling roughly $15,800 prior to the federal tax credit would see a subsequent rise in home value of about $14,200.
Other Solar Payment Options
As previously noted, individuals who do not want to purchase a system but are interested in using solar power may consider solar loans, or solar leases and power purchase agreements (PPAs). Solar loans are similar to many home improvement loans. Homeowners may borrow money from a bank or solar installer, agreeing to pay it back – plus interest – in monthly installments over the loan term. Solar loans can be secured or unsecured and work similarly to a typical loan.
As a second alternative, solar leases and PPAs allow homeowners to rent a solar panel system from the solar panel company that owns it. Homeowners receive the energy they produce, but do not own the panels themselves. As a result, households choosing this option will not receive additional solar incentives since those are solely given to the owner of the solar panel system – in this case, the third-party owner.
Data and Methodology
Our study is intended as a guide to think about solar panels relative to your finances. Data for this report comes from four primary sources: the U.S. Energy Information Administration, Lawrence Berkeley Labs, EnergySage and SolarReviews. Sources for the state-level solar savings calculations are listed below:
- Electricity rate for residential customers. This is the average price between August 2019 and July 2020. Data comes from the U.S. Energy Information Administration.
- Average solar panel cost in each state. This is for a six-kilowatt system. Data comes from SolarReviews and is for September 2020.
- Electricity demand. Data comes from the U.S. Energy Information Administration and is for 2018.
- Electric utility inflation rate. We calculated this figure using data from the U.S. Energy Information Administration spanning January 2001 through December 2019. We expect electricity rates to rise by at least the same annualized rate looking ahead over the next 20 years.
- Need met by solar panels. This figure comes from EnergySage.
We calculated the 20-year cost of electricity with and without solar power. States where solar power may pay off the most are those with the largest difference between the two. Note: We excluded Hawaii and Alaska from our analysis of states where solar power may pay off the most, as both states experience significant variations in sunlight compared to the contiguous U.S.
Tips for Solar Shoppers
- See what your solar savings could be. EnergySage and Google’s Project Sunroof may be useful tools to see if solar panels are the right option for your specific home. Both let you input your home address and average monthly electricity bill to perform more specific calculations on your savings. New homebuyers may want to use those tools in conjunction with SmartAsset’s mortgage calculator to see how their total home finances will add up.
- Get a constellation of quotes. Research shows that when it comes to solar energy, it pays to shop around. A study published by the National Renewable Energy Laboratory found that large installers in the solar industry were on average 10% more expensive than smaller contractors. Additionally, EnergySage finds that homeowners who get three or more quotes can expect to save between $5,000 and $10,000 on their solar panel installation.
- Seek out stellar advice. Similar to many other financial decisions, solar panels are an investment. If you want help forming a more comprehensive plan on how solar panels could fit into your financial planning, it may help to speak with an expert. Finding the right financial advisor doesn’t have to be hard. SmartAsset’s free tool matches you with financial advisors in your area in just five minutes. If you’re ready to be matched with local advisors that will help you achieve your financial goals, get started now.
Questions about our study? Contact us at press@smartasset.com
Photo credit: ©iStock.com/narvikk