 Written by
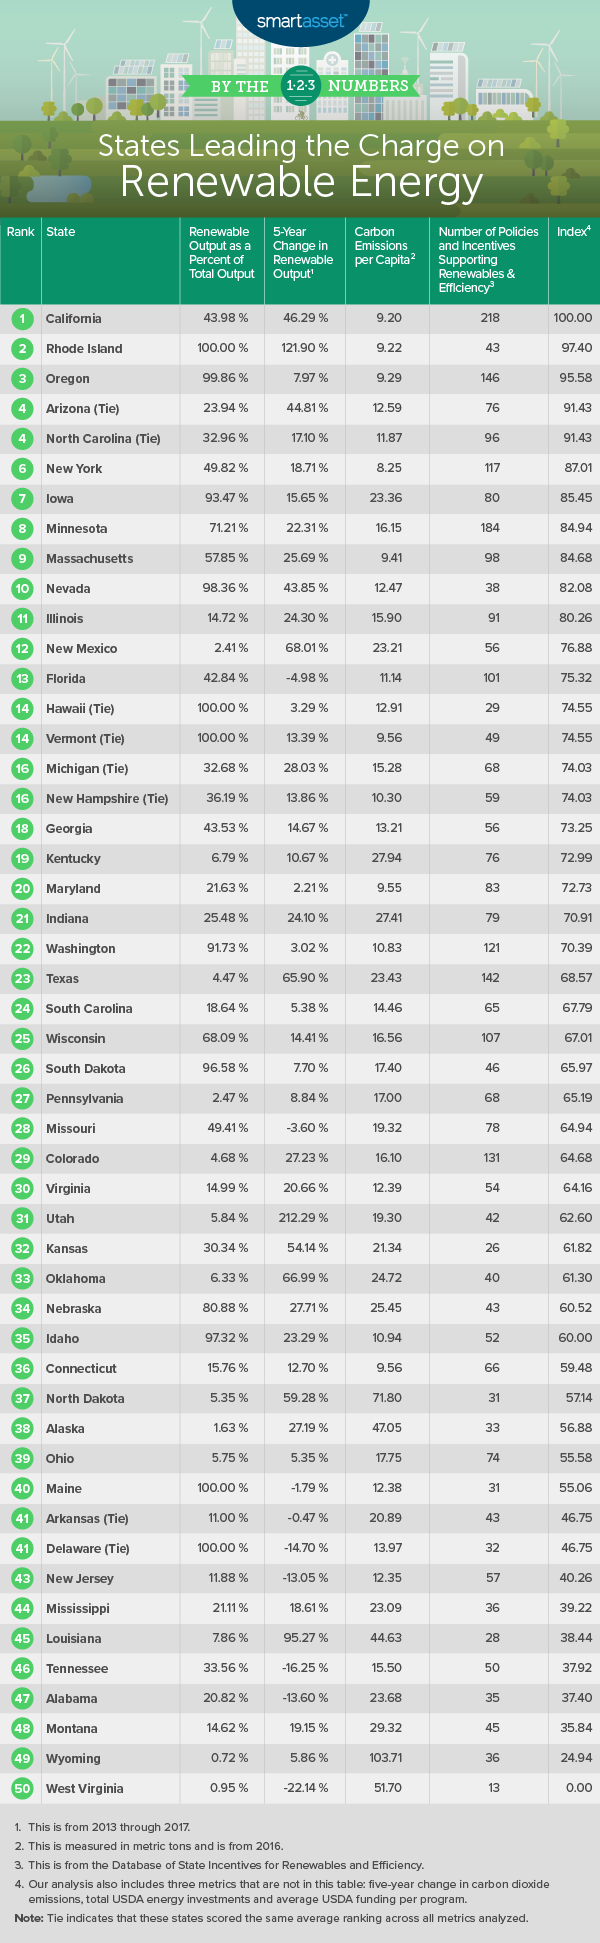
State energy efficiency and renewable energy programs may produce significant benefits for residents including lower fuel and electricity costs, increased grid reliability, better air quality and more job opportunities, according to a 2018 Environmental Protection Agency (EPA) report called “Quantifying the Multiple Benefits of Energy Efficiency and Renewable Energy.” Some states have transitioned to clean energy more quickly than others. For instance, between 2013 and 2017, Utah increased its renewable energy production by 212.29% while West Virginia’s renewable energy production decreased by 22.14%. This can be an important consideration for people when deciding where to buy a home.
In this study, we looked at some of the states leading the charge on renewable energy. Specifically, we compared states across seven metrics related to renewable energy that include both policies and results. For details on data sources and how we put all the information together to create our final rankings, check out the Data and Methodology section below.
Key Findings
- Renewable energy production has generally increased. While West Virginia’s renewable energy production decreased from 2013 to 2017, it is one of only nine states for which that is the case. The remaining 41 states all increased renewable energy production over that time period, and the average increase in production across all states is greater than 25%.
- The South populates the bottom 10. According to Census divisions, only one Southern state makes it into our top 10 – North Carolina. Seven of the states in our bottom 10 are in the South. They include Arkansas, Delaware, Mississippi, Louisiana, Tennessee, Alabama and West Virginia, ranking 41st, 42nd, 44th, 45th, 46th, 47th and 50th.
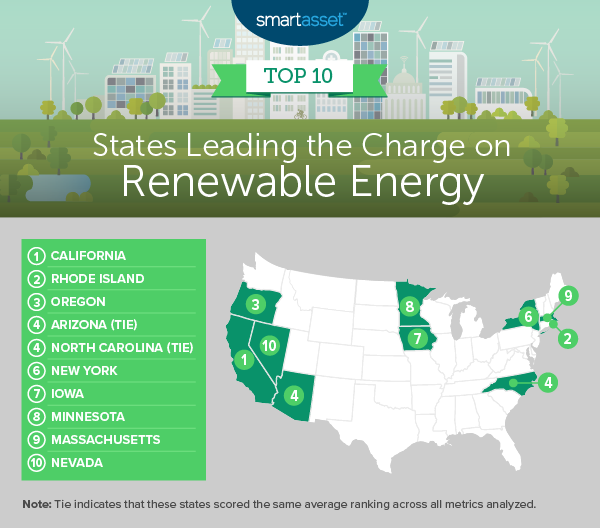
1. California
California is the No. 1 state leading the charge on renewable energy. California has the greatest number of policies and incentives that promote renewable energy and energy efficiency of any state. According to the Database of State Incentives for Renewables and Efficiency (DSIRE), which tracks grants, loans, rebates and tax credits by state, there are 218 total policies and incentives encouraging individuals and businesses in California to use more renewables.
Additionally, California has the second-lowest carbon emissions per capita in our study, falling behind only New York, and the ninth-highest increase in renewable energy production over the five-year period from 2013 to 2017. Specifically, renewable energy production increased during those years by 46.29%. In 2016, 9.20 metric tons of carbon were emitted per person in California.
2. Rhode Island
Rhode Island ranks second in our study. Between 2012 and 2016, Rhode Island reduced its carbon dioxide output by 8.42%, decreasing yearly output from 10.7 million metric tons of carbon in 2012 to 9.8 million in 2016. This was the seventh-largest percentage reduction in carbon dioxide output of any state over that five-year time period. With that reduction, Rhode Island has the third-lowest rate for carbon dioxide emissions per capita in 2016, at 9.22 metric tons of carbon dioxide per person.
The reduction in carbon dioxide may be a result of Rhode Island’s strong reliance on renewables. According to data from the Energy Information Administration (EIA), in 2017 all energy production in Rhode Island came from renewables. If you’re looking to move or upgrade your home to account for better energy efficiency, be sure to consider Rhode Island property taxes.
3. Oregon
Like Rhode Island, Oregon relies almost entirely on renewable energy. In 2017, 99.86% of energy production in Oregon came from renewables, the sixth-highest of any state, falling behind Rhode Island, Hawaii, Vermont, Maine and Delaware, all of which rely solely on renewables. Oregon also has the third-highest number of policies and incentives promoting renewable energy of any state in our study with 146, following California with 218 and Minnesota with 184.
4. Arizona (tie)
Arizona, tied with North Carolina for the No. 4 spot, ranks in the bottom half of the study in terms of its 2017 renewable energy as a percentage of total energy production, with only 23.94% of energy production coming from renewables. Arizona ranks well, however, across the six other metrics we considered. Five-year renewable energy production increased by 44.81% leading up to 2017 – the 10th-highest percentage increase in the study – and carbon dioxide emissions decreased by 5.71% in the five years leading up 2016 – the 16th-largest percentage reduction in the study. In addition, many cities in Arizona, particularly in the Phoenix area, rank well in our study on where to buy a family home.
4. North Carolina (tie)
North Carolina ties with Arizona for fourth place in our study on the states leading the charge on renewable energy. Since 2003, the U.S. Department of Agriculture (USDA) has provided funding to states or business owners within the state for renewable energy and energy efficiency projects. One of the top 10 states in our 2019 study of where rich millennials are moving in 2019, North Carolina has received the most funding from the USDA, a total of about $826 million, for clean energy projects and investments. Additionally, the average amount of funding for each program in North Carolina is the fifth-highest in the study, at $599,472.
6. New York
New York comes in sixth. As noted by the EIA, a large portion of the population in New York lives within the New York City metropolitan area, where mass transit is readily available and multi-family units are prevalent, allowing for efficiency of scale in energy usage. As a result, New York has the lowest 2016 emissions of carbon dioxide per capita, about 8 metric tons, across all states in the study.
New York also has the seventh-highest number of policies and incentives supporting renewable energy of any state. According to DSIRE, New York has a total of 117 policies and incentives supporting renewable energy usage.
7. Iowa
Iowa, ranking seventh overall, has the highest carbon dioxide emissions per capita of any state in our top 10. In 2017, 23.36 metric tons of carbon dioxide were emitted per person, the 13th-highest rate across all states. However, the numbers indicate that Iowa is working to reduce carbon dioxide production. Between 2012 and 2016, carbon emissions in the state decreased by 8.78%, the sixth-largest percentage reduction over that period in our study. Potentially lower fuel and electricity costs resulting from this change could significantly affect residents’ mortgage timeline for the better.
8. Minnesota
Taking the No. 8 spot in our top 10, Minnesota has 184 policies supporting renewable energy and energy efficiency according to DSIRE, the second-largest amount for this metric in the study. These policies seem to be generally successful: In 2017, 71.21% of energy production came from renewable sources, a top-15 rate. Additionally, Minnesota saw an increase in renewable energy production in the five years leading up to 2017, at a rate of 22.31%, ranking in the top half of the study for this metric. What’s more, Minnesota is also one of 2019’s best states for homeowners.
9. Massachusetts
Though carbon emissions in Massachusetts actually increased by 2.96% between 2012 and 2016, only 9.41 metric tons of carbon dioxide were emitted per person in Massachusetts in 2016, the fifth-lowest rate for this metric of any state in our study. Additionally, Massachusetts relies a fair amount on renewable energy sources. In 2017, 57.85% of energy production came from renewables, a top-15 rate.
10. Nevada
Nevada rounds out our list of the top 10 states leading the charge on renewable energy. Like North Carolina, Nevada has received a significant amount of funding from the USDA for clean energy projects. Since 2003, it has received a total of approximately $316 million, the fifth-largest amount in the study. The average funding per program, an estimated $2.9 million, is the highest amount of any state. Furthermore, in 2017, Nevada’s renewable energy as a percentage of total energy was 98.36%, the seventh-highest rate for this metric in the study.
Data and Methodology
To find the states leading the charge on renewable energy, SmartAsset looked at data for all 50 states. Specifically, we compared the states across the following seven metrics:
- Renewable output as a percentage of total energy production. This is renewable energy production divided by total energy produced in each state. Data is for 2017 and comes from the Energy Information Administration (EIA).
- Five-year change in renewable energy output. Data comes from the EIA and is for 2013 to 2017.
- Per-capita carbon emissions. Data comes from the EIA and is for 2016. Units are in metric tons of carbon dioxide per person.
- Five-year change in carbon emissions. Data comes from the EIA and is for 2012 to 2016. Units are million metric tons of carbon dioxide.
- Number of policies and incentives encouraging renewable energy development. This includes grants, loans, rebates and tax credits. Data comes from the Database of State Incentives for Renewables and Efficiency (DSIRE) and was pulled in September 2019.
- Total USDA energy investments. This is the total amount of funding received by the state from 2003 to 2019 from the U.S. Department of Agriculture (USDA) for renewable energy and energy efficiency projects and investments. Data was pulled in September 2019.
- Average USDA funding per program. This is the total USDA energy investment amount divided by the number of USDA-funded programs in the state. Data was pulled in September 2019.
To create our final score we ranked each state in each metric. Then we found each state’s average ranking, giving equal weighting to all metrics except total USDA energy investments and average USDA funding per program, which each received a half weight. We used this average ranking to create our final score. The state with the best average ranking received a score of 100. The state with the worst average ranking received a score of 0.
Tips for Finding a Home
- Make sure you can handle a mortgage. If you’re thinking about settling into a new home, recognize that a mortgage is a big commitment. Be certain you’ll be able to afford whatever you’ll end up having to pay. Use SmartAsset’s mortgage calculator to see the ideal range in which you should be shopping.
- Trusted personal finance advice. A financial advisor can help you make smarter financial decisions such as moving or being in better control of your money as you navigate finding a new job or helping a loved one pay for educational costs. Finding the right financial advisor that fits your needs doesn’t have to be hard. SmartAsset’s free tool matches you with financial advisors in your area in 5 minutes. If you’re ready to be matched with local advisors that will help you achieve your financial goals, get started now.
Questions about our study? Contact us at press@smartasset.com
©iStock.com/Cindy Shebley