 Written by
Taking out a mortgage to buy a home can be a great investment (as long as you are buying a home you can afford, of course). Just take a look at the average American home. The median home in America increased in value by $10,500 between 2015 and 2016. That’s only an increase of around 5% but for the average household in America, which took home $57,617 last year, an extra $10,500 would be worth 18% of their annual income.
But in some American cities, the increase in median home values surpasses the local median household income. Below we take a closer look at where home appreciation is worth the most by comparing it to local incomes. To do this, we looked at the one-year change in home values from 2015 to 2016 and compared it to the median household income in 2016. Check out our data and methodology below, to see where we got our data and how we put it together to create our final rankings.
Key Findings
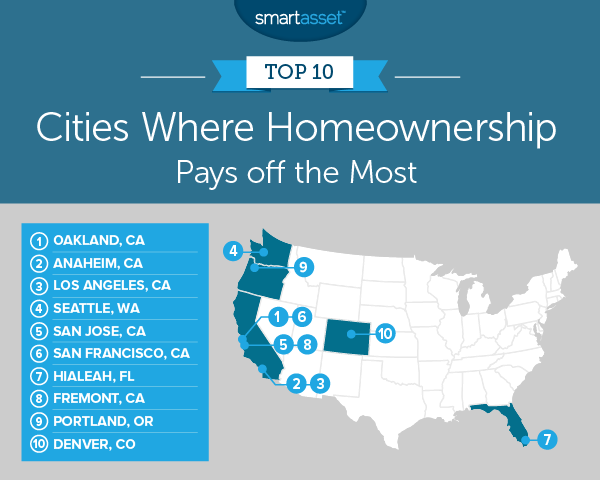
- California homes have appreciated the most – There are six California cities in the top 10. In fact, four of the top five cities where home appreciation is worth the most are in California. The Bay Area ranks particularly well, with Oakland, San Francisco and Fremont all taking top 10 spots.
- Home values aren’t increasing everywhere – In total there are 11 cities where the median home is depreciating in value. No state is over-represented in this list. The bottom three cities where home value depreciation hurts homeowners the most are Baton Rouge, Louisiana; Norfolk, Virginia and Miami.
1. Oakland, California
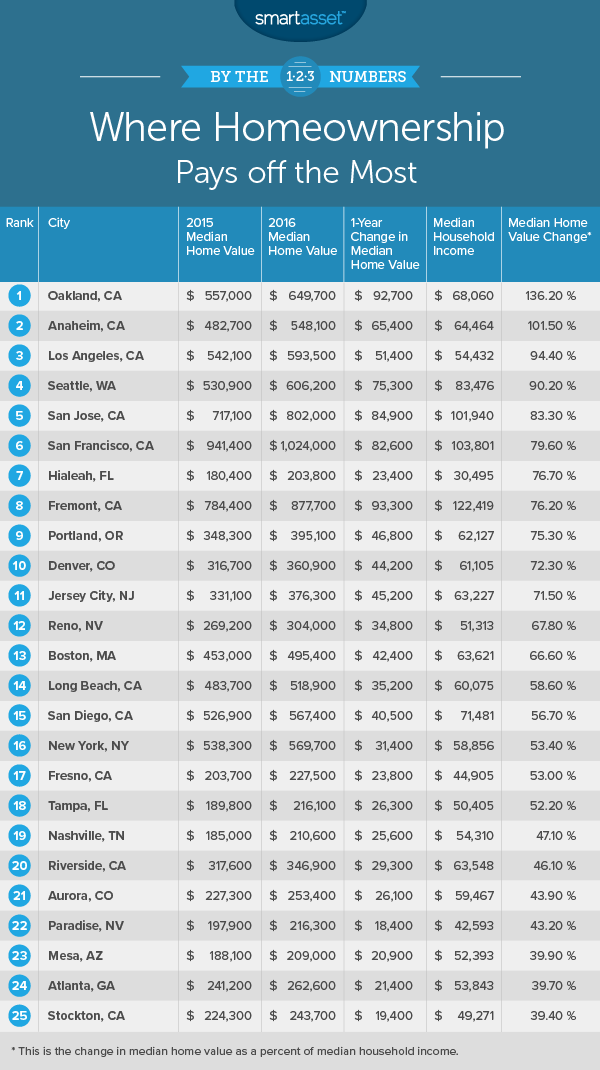
Oakland ranks first in this study. From 2015 to 2016, the median home in Oakland went from being worth $557,000 to being worth $649,700. That’s an increase of $92,700, or 16.6%. For the average Oakland household with an income of $68,060, a housing value increase of $92,700 is equal to 136% of their salary.
No other city has such a large disparity between household income and home value appreciation.
2. Anaheim, California
Another California city, Anaheim ranks second. The median home value in Anaheim rose from $482,700 in 2015 to $548,100 in 2016. That is an increase of roughly 14% or $65,400. The median household in Anaheim takes home $64,464 per year, meaning the average increase in home value is worth more than the city’s median household income.
However, the home appreciation windfall is not evenly spread throughout the city. Only about 41,200 of the 99,300 households in Anaheim are owner-occupied.
3. Los Angeles, California
Los Angeles is another city with sky-rocketing home values. From 2015 to 2016, the median home increased in value by $51,400, from $542,100 to $593,500. That increase in value is worth 94% of the median household income in the city.
That is great news for homeowners, but renters are likely feeling the squeeze of increasing home values. The homeownership rate in Los Angeles is only 36%, and from 2014 to 2016 the median rent in Los Angeles increased by $100.
4. Seattle, Washington
Seattle has become infamous for its rising mortgage costs. In 2015, the average home in Seattle was worth $530,900. By 2016, the median home value had jumped to $606,200. That’s an increase of $74,300, or 14%.
The median household in Seattle has an income of $83,500, meaning $74,300 is equal to 90% of that income.
5. San Jose, California
San Jose takes fifth, despite having one of the highest median incomes in the country. The median household in San Jose takes home just under $102,000, the second-highest amount in our top 10. The median home in San Jose increased by $84,900 from 2015 to 2016. That increase in home value is equivalent to 83% of the median household income.
San Jose has a homeownership rate around 57% so most residents in this city should be enjoying the gains in home values.
6. San Francisco, California
The posterchild for increasing home values takes sixth. The average home in San Francisco as of 2016 was worth more than $1 million. That is an increase of $82,600, or 9%, from 2015. While $82,600 is the fourth-largest appreciation overall, relative to local household income it is only the sixth-largest increase.
The median household in San Francisco earns $103,800, making the average home value appreciation worth roughly 80% of the median household income.
7. Hialeah, Florida
Hialeah, Florida is one of the most severely housing cost-burdened cities in America. It’s also the city with lowest median household income to appear in our top 10. The median household in Hialeah takes home just under $30,500 per year. From 2015 to 2016, the median home in Hialeah increased in value by $23,400.
8. Fremont, California
No city in our top 10 has a higher median household income than Fremont. The average household in this Silicon Valley city earns over $122,400 per year. From 2015 to 2016, the median home in Fremont increased in value from $784,400 to $877,700. That is roughly a gain of $93,000.
For the average household in Fremont an extra $93,000 is worth 76% of annual income.
9. Portland, Oregon
Portland, Oregon ranks ninth. Homes here are relatively affordable by the standards of this top 10. In 2016, the median home was worth 6.4 times the median household income.
However, that may change if homes continue to appreciate at their current rate. From 2015 to 2016, the median Portland home increased in value by $46,800. That increase in home values is equal to 75% of the area’s median household income.
10. Denver, Colorado
Denver ranks 10th. In just the one year, between 2015 and 2016, the median home in Denver increased $44,200, or 14%.
The city’s median household income is $61,105, meaning $44,200 is equal to 72% of the average household’s income.
Data and Methodology
In order to rank the cities where home appreciation is worth the most, we looked at data for the largest 100 cities in America. Specifically, we compared them across the following two metrics:
- Median household income. This data comes from the Census Bureau’s 2016 1-year American Community Survey.
- One-year home value appreciation. This is the increase in median home values from 2015 to 2016. Data comes from the Census Bureau’s 2015 and 2016 1-Year American Community Surveys.
To rank the cities, we divided the one-year home value appreciation by the median household income. The city with the highest subsequent number (i.e. the city where home value appreciation was worth the most relative to local income) ranked first. The city with the lowest figure ranked last.
Tips for Finding an Affordable Home
- Buying isn’t for everyone – As our data above showed, homes can make great investments. But at the bottom of our study, we also found that home values are depreciating in some cities. Make sure you do your research if you are planning on buying a home. Home buying is no guarantee of future wealth and you should consider whether it is best for you to rent or buy, depending on your specific financial circumstances.
- Get an expert’s opinion – You will likely not make a larger purchase in your life than your home. That means it’s a good idea you take time and talk to an expert, like a financial advisor. A financial advisor can help you understand how homeownership fits in with the rest of your financial milestones. If you are unsure of how to find a financial advisor or what you are looking for in a financial advisor, try SmartAsset’s financial advisor matching tool. It will match you with a local financial advisor who fits your specific needs.
- Property taxes and other add-ons can be costly – Depending on where you live, property taxes could be the difference between buying a home you can afford and one you can’t. The average property taxes in Hawaii and California tend to be lower than the national average, while property taxes in New Jersey and Illinois are among the highest in the country.
Questions about our study? Contact press@smartasset.com.
Photo credit: ©iStock.com/PeopleImages