 Written by
People choose where to live based on a variety of factors. Although safety may not the number one concern for everyone, it is certainly a factor most people consider when deciding on a place to call home. People typically think of safety in terms of crime but other factors like bad air quality or the prevalence of reckless drivers also make for an unsafe environment. We looked at these and other factors to create a ranking of the safest cities in America for 2016.
This is SmartAsset’s second annual study of the safest cities in America. Read the 2015 version here.
To find the safest cities in the U.S., SmartAsset looked at data for the largest 200 cities across a number of different metrics like violent crime, property crime, air quality and motor vehicle accidents. We also considered the percentage of people commuting to work alone, drug use and excessive drinking. In order to understand where we got our data and how we used it, please read the full Data and Methodology below.
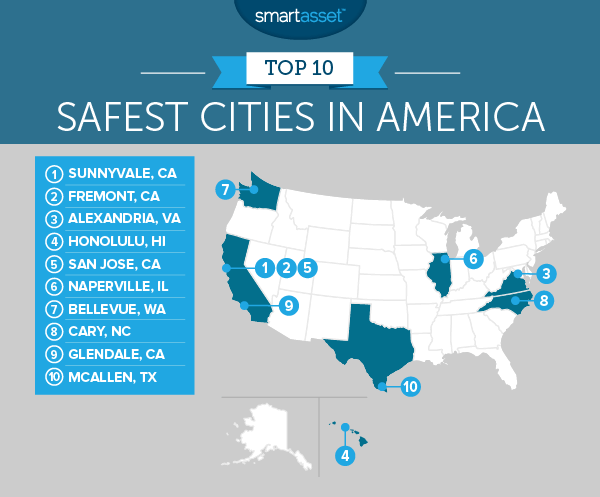
Key Findings
- The Bay Area is even safer – Last year the Bay Area had three cities in the top 10 – Sunnyvale, Freemont and San Jose. Those cities are back this year and ranking even higher.
- Safety first, California – While the Bay Area is the safest part of California, we’d be remiss if we didn’t highlight the rest of the state, as well. California has 10 out of the top 25 safest cities in America.
- Missouri bottoms out – Three cities in Missouri – St. Louis, Springfield and Kansas City – ranked at the bottom 15 of our list.
1. Sunnyvale, CA
Sunnyvale commands the number one spot for the second year in a row in our safest cities ranking. Since last year’s study, the city’s violent crime rate declined slightly from 118 violent crimes per 100,000 residents to 103 violent crimes per 100,000. Sunnyvale has solid scores across the board. The city’s low rates of drug use and excessive drinking are of particular note.
2. Fremont, CA
Fremont, Sunnyvale’s Bay Area neighbor and main competitor for the top spot, climbed four spots from last year. Fremont has a violent crime rate of 144 per 100,000 residents as well as a property crime rate of 1,880 per 100,000 residents. Both of these scores are slightly below Sunnyvale’s but rank high nationally. Fremont’s best score is its vehicular mortality rate – just 5.54 per 100,000 residents.
3. Alexandria, VA
This D.C. suburb snagged the third spot on our top 10 list. One of the reasons it ranked so well is that its residents are among the least car-reliant in the country. A simple explanation for this is Alexandria’s proximity to D.C. and shared metro system mean that many residents do not drive to work alone. In fact, only 58.7% do. Another benefit of spending less time behind the wheel is the city’s low number of motor vehicle-related deaths. Alexandria’s vehicular mortality rate of 4.7 fatalities per 100,000 residents is the sixth best in the country.
4. Honolulu, HI
The air in beautiful, tropical Honolulu is some of the best in the country. The ninth best to be precise, according to EPA data. Hawaii’s capital also has a relatively low violent crime rate of 243.8 per 100,000 residents. However data shows that 20.1% of the population engages in reckless drinking, which hurts its overall safety score.
5. San Jose, CA
We recently named San Jose one of the most livable cities in the U.S., so we weren’t surprised to see it pop up again in the discussion on the safest cities. According to FBI data, both violent and property crime rates are down in San Jose as compared to last year. The city is also tied with Sunnyvale for the second-lowest excessive drinking rate in the top 10.
6. Naperville, Illinois
Naperville is one of the newcomers to this year’s study. Data shows that the property crime rate fell from 1,431 crimes per 100,000 residents to 1,123 crimes per 100,00 residents since last year’s study. Its property crime rate is now second best in the country. Naperville also ranks second for lowest vehicular mortality rate and fourth-lowest for violent crime.
7. Bellevue, WA
Bellevue is the smallest city to make our top 10. Bellevue offers its residents a low violent crime rate of 113 violent crimes per 100,000 residents and a low vehicular mortality rate of 5.45 fatalities per 100,000 residents. It’s not ranked higher because over 21% of the population engaged in excessive drinking.
8. Cary, NC
Cary dropped a few spots from last year’s ranking but still put up some impressive scores. In fact, if we were just measuring violent crime rate, Cary would be the safest city in the U.S. Data shows it has only 50 violent crimes per 100,000 residents. This is an improvement from last year’s study when the rate was 81 per 100,000 residents.
9. Glendale, CA
This Southern California city combines low violent and property crime rates with a low drug poisoning mortality rate to make for one of the safest living environments in the U.S. Like other places around Los Angeles the air quality is not very good in Glendale. The EPA gives them a 67 on the air quality index which is 170th in our data set.
Wondering what taxes are like in California? Read all about California income tax, sales tax and other taxes here.
10. McAllen, TX
This city near the Mexico border rounds out our top 10 of the safest cities in America. It has a population of 140,053 and a violent crime rate of only 108 per 100,000 residents. It also ranks well for drug poisoning mortality rate, percentage of population engaged in excessive drinking as well as air quality. McAllen scored in the top 20 in all these metrics.
Data and Methodology
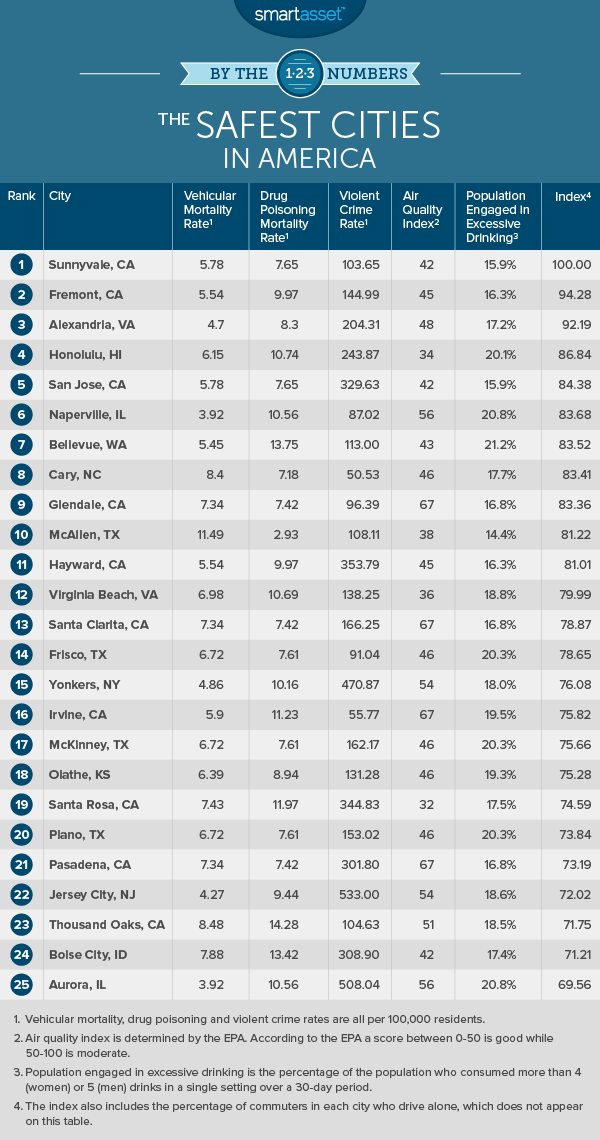
To determine the safest cities in America, SmartAsset looked at data on the largest 200 cities in the country. We considered the following seven metrics, which are reflective of some of the leading causes of death and injury in the country.
- Violent crime rate. This is the number of violent crimes per 100,000 residents. The violent crime data comes from FBI’s 2015 Uniform Crime Reporting Program and from local police departments and city websites.
- Property crime rate. This is the number of property crimes per 100,000 residents. The property crime data comes from FBI’s 2015 Uniform Crime Reporting Program and from local police departments and city websites.
- Vehicular mortality rate. This is the number of automobile accident deaths per 100,000 residents. The 2016 data comes from countyhealthrankings.org.
- Drug poisoning mortality rate. This is the number of drug poisoning deaths per 100,000 residents. The 2016 data comes from countyhealthrankings.org.
- Population engaging in excessive drinking. This is the percentage of the population who consumed more than four drinks of alcohol for women or five drinks of alcohol for men on a single occasion over a 30-day period. The 2016 data comes from countyhealthrankings.org.
- Air Quality Index. This is a measure of air pollution in each city. The 2016 Air Quality Index data comes from the Environmental Protection Agency. According to the EPA, a score of 0-50 is good and 51-100 is moderate.
- Commuters driving to work alone. This is the percentage of the workforce that gets to work by driving alone. The data on the percentage of commuters who drive to work alone comes from the U.S. Census Bureau’s 2015 American Community Survey.
We ranked each city across these seven metrics, giving double weight to the violent crime rate and half weight to the population engaging in excessive drinking and the drug poisoning mortality rate. We then created an index based on those averages. The city with the highest average ranking recieved a 100 and the city with the lowest average ranking received a 0.
Questions about our study? Contact us at press@smartasset.com.
Photo credit: ©iStock.com/GerardoBrucker