Big-city living comes with quite a few perks. Grocery stores and shopping centers are often in walking distance and there are usually plenty of restaurants, bars and activities close by. But when you live in a city with a high cost of living, you have less purchasing power. You might spend a lot more on housing, food and healthcare than you would if you lived somewhere else.
This is the 2016 version of SmartAsset’s study. Read the 2017 version or the 2015 study.
According to Harvard’s Joint Center for Housing Studies, just 54% of U.S. renters in 2014 had affordable housing. The rest used more than 30% of their salaries to pay for housing costs. That means that millions of Americans were paying too much for rent, leaving them with less money to spend on other essentials or to put toward investing and saving for retirement.
Living in a large city may be unavoidable, especially if your college or job is located in one. But having a general sense of how much rent will cost might make it easier to plan ahead if you’re preparing to move out of a small town or suburb.
Find out more: For help with retirement, consider working with a fee-only financial planner.
To find out how much households need to make to pay the rent, we looked at April 2016 fair market rents for two-bedroom apartments in the 300 largest U.S. cities.
The Department of Housing and Urban Development (HUD) uses a 30% threshold to identify which housing is affordable. Households that spend more than 30% of their income on housing costs are considered cost-burdened households. When they spend 50% or more of their income on housing-related expenses, they fall into the category of severely cost-burdened households.
We took HUD’s affordability threshold into consideration and decided that households should spend less than 30% of their income on rent. So we used a 28% rent-to-income ratio to determine how much money households needed to afford rent in all 300 cities. Then we zeroed in on the main cities within the 15 largest metro areas. (Read more about our full methodology below.)
Key Findings
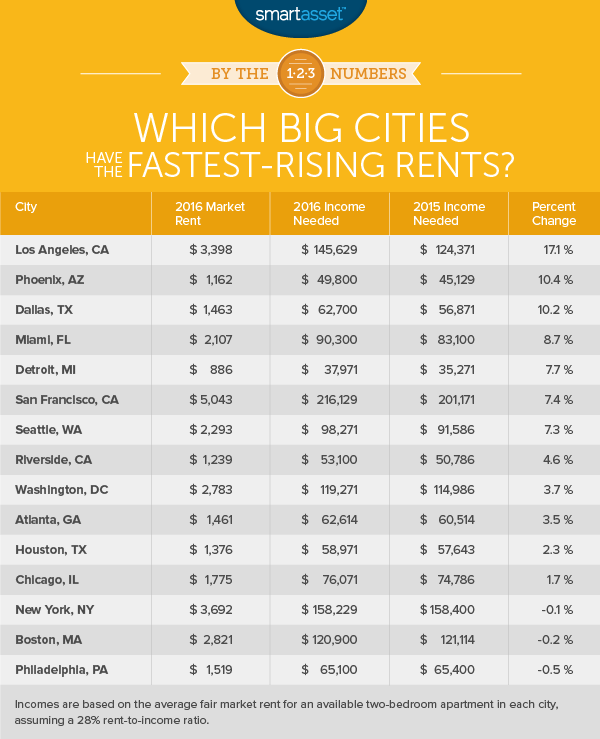
- Market rents are going up. Out of the 15 big cities that we analyzed, only three of them saw average rental rates fall between 2015 and 2016. Among the trio with declining rents, none of their fair market rents dropped by more than half of a percentage.
- Rates are rising fastest in the Southwest. In the past year, market rents have climbed at a faster rate in Los Angeles, Phoenix and Dallas than in the other major cities we examined.
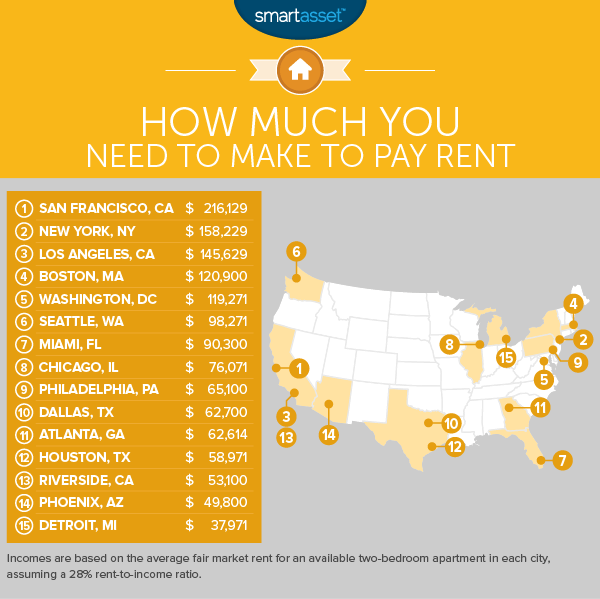
San Francisco, California $216,129
If you’re moving to San Francisco, be prepared to spend a significant portion of your salary on housing. You’ll find the country’s most expensive rental markets in the Golden City. To afford a two-bedroom apartment, you’ll need to make at least $216,129 annually.
While rental rates have increased in recent years, wages haven’t kept up. The median household income in the city is only $78,378.
New York, New York $158,229
If you love New York and you’ve decided to live in the city, you’ll have to learn to love the high cost of housing, food and transportation. In the Big Apple, the cost of living is nearly 70% higher (or more than that in some neighborhoods) than average costs in the rest of the nation.
Renting a two-bedroom place in New York City will cost you $3,692 a month, on average. That price has actually dropped by 0.1% since 2015. Still, that’s hardly good news for most of the city’s cost-burdened renters.
Los Angeles, California $145,629
The fair market rent for a standard apartment in the Los Angeles increased by 17.1% between 2015 and 2016. None of the other cities in our study saw market rents rise by quite that much.
Annually, median housing costs for LA residents are around $20,496, according to the U.S. Census Bureau. If you’re a new transplant, you’ll need to be ready to pay a lot more for all sorts of expenses.
Boston, Massachusetts $120,900
A Boston apartment with a couple of bedrooms will cost you $2,821 per month, on average. If you can’t afford that, consider checking out apartments in some of the cities nearby.
Lowell, for example, is roughly 30 miles from Boston and you’ll only need to make $59,143 per year to rent a place there. Cambridge, however is even pricier. Market rents for two-bedroom apartments in the college town are 7.4% higher than they are in Boston.
Washington, D.C. $119,271
Living with a roommate in the nation’s capital isn’t such a bad idea. Our analysis shows you’ll need to make at least $119,271 per year to afford a two-bedroom apartment. Sharing a space with someone will save you close to $600, on average, if you split the rent down the middle.
Related Article: What a Roommate Saves You in 50 U.S. Cities
Seattle, Washington $98,271
Based on our analysis, you would need an annual salary of $98,271 to afford rent in Seattle. Unemployment for the Seattle-Tacoma-Bellevue metro area is 5.1% (as of March 2016), according to the BLS. That’s 12.8% lower than the unemployment rate for the state of Washington.
Those numbers might make living in Seattle seem a bit more appealing. Plus, it’s the perfect place to get your caffeine fix on a daily basis.
Miami, Florida $90,300
Miami is notoriously a popular spot for college students who travel during spring break. But it’s an expensive place to live year-round. In fact, out of the 15 big cities we looked at, it’s the seventh least affordable place for renters who want an apartment with a second bedroom.
Chicago, Illinois $76,071
Market rents in Chi-Town for 2016 are 1.7% higher than they were in 2015. That’s not exactly something to get excited about. But compared to rival cities like New York City and Los Angeles, rental rates in the Windy City are 70.1% and 62.7% cheaper, respectively.
Philadelphia, Pennsylvania $65,100
According to the U.S. Census Bureau, unemployment in Philly was 14.9% in 2014. But adults between the ages of 20 and 24 were faced with an even higher unemployment rate of 25.1%.
If living with parents or relatives isn’t an option, recent college grads from schools like Temple University, Drexel University and the University of Pennsylvania need to be prepared to spend an average of $1,519 on rent every month if they don’t mind sticking around and shacking up with a roommate. But unless their entry-level gigs pay them at least $65,100, finding affordable housing in the city could be difficult.
Dallas, Texas $62,700
Houston communities are still putting themselves back together following the historic floods that hit the area in 2016. Dallas is typically prone to storms and flooding as well due to its hot, sticky climate. But the weather isn’t stopping people from wanting to settle down in the metro area. Recent reports show that in the first quarter, new home building rates were 39.1% higher than they were in the first few months of 2015.
But homebuying still remains out of reach for many Dallas millennials, particularly those with a preference for brand new homes. Those who are stuck renting will find that average market rents have increased at a faster rate than all but two of the big cities in our study.
Atlanta, Georgia $62,614
Recent data from Zillow shows that median home values in Atlanta are $150,100. Home prices are on the rise, but for a big city, they’re still pretty reasonable. Median annual housing costs add up to $13,200, according to the Census Bureau. If you’re not ready to become a homeowner, you can expect to spend $1,461 a month to rent a two-bedroom in Atlanta, on average.
Houston, Texas $58,971
SmartAsset found that residents in Houston need salaries of at least $58,971 to pay the rent if they’re checking out two-bedroom apartments. Fair market rents are 36% of the city’s median household income, which is $45,728.
Since rent makes up more than 30% of household income, it doesn’t meet HUD’s housing affordability standard. But Houston is more affordable than both Dallas and Austin, where city dwellers need to make a minimum of $64,671 if they’re planning on renting.
Riverside, California $53,100
Riverside is a little more than 100 miles from San Diego, where market rents are about 57.6% more expensive. With a population of more than 300,000, the Southern California city is known for its diversity, its rich culture and its appreciation for art.
Phoenix, Arizona $49,800
Renters who long to live in a large city should be pleased to find that Phoenix is a lot cheaper than most of the other places on our list. As long as you earn at least $49,800 annually, you should be able to keep up with your monthly rental payments on a two-bedroom apartment.
If you postponed your move to the area, however, you might be somewhat upset. Market rents have increased by 10.4% in the past year.
Detroit, Michigan $37,971
In our analysis of rental rates in the 15 principal cities of the biggest metro areas, Detroit had the cheapest fair market rent. On average, you would pay just $886 each month for a two-bedroom apartment in the Motor City. But that’s 7.7% more than what renters paid for apartments in 2015.
Methodology and Sources
To calculate the amount of income needed to pay rent, we set our rent-to-income ratio at 28%. Why 28%? Government housing standards say that housing is affordable if it doesn’t require a household to spend more than 30% of its income on housing-related expenses including utilities and rent. Therefore, we allowed for households to spend no more than 28% of their income on rent alone.
In total, we looked at market rents for the 300 largest cities in America. Using our 28% rent-to-income ratio, we found out how much households needed to make in a year to pay for two-bedroom apartments. From there, we focused our attention on the principal cities of the 15 largest U.S. metro areas.
Finally, we wanted to get a sense of how market rents had changed in a single year. So we compared our latest numbers to those from our 2015 data set.
The data in our analysis comes from myapartmentmap.com, which keeps track of fair market rents for apartments nationwide. Since we looked at average fair market rents for April 2016, (the average costs of renting an available apartment) the amount of rent you’re currently paying could be significantly lower than what we reported.
Questions about our study? Contact us at blog@smartasset.com.
Photo credit: ©iStock.com/ozgurdonmaz