 Written by
Though the U.S. doesn’t rank as the happiest country in the world (that honor goes to Denmark) Americans report high levels of life satisfaction. The U.S. ranked 13th in a recent World Happiness Report that looked at 156 countries. But how do individual counties within the U.S. stack up in the happiness stakes? Let’s take a look.
This is SmartAsset’s second annual study of the happiest counties. Check out the 2015 rankings here.
Study Specifics
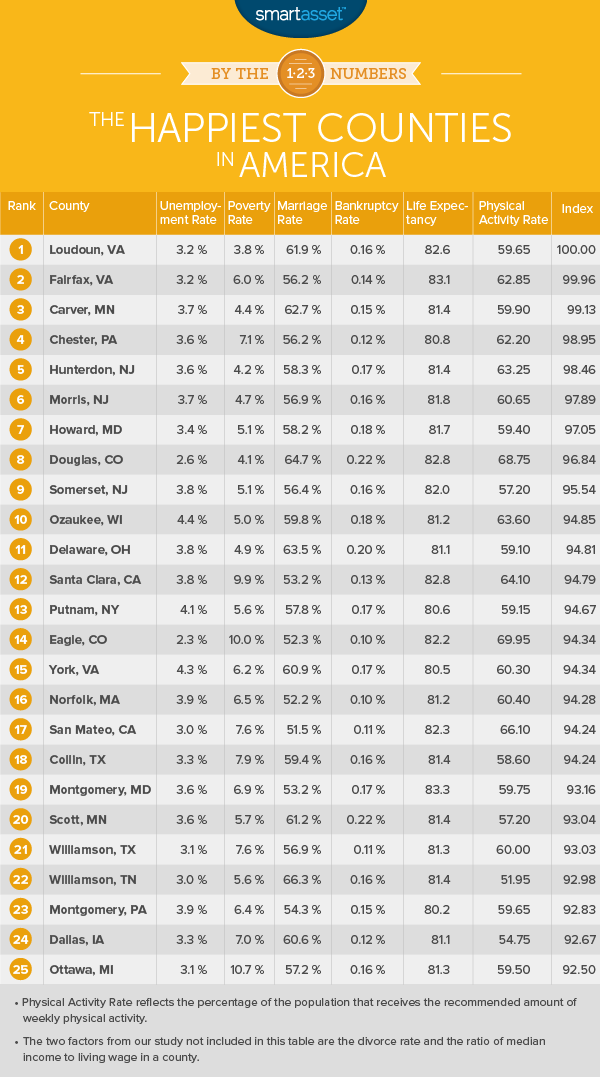
To get our ranking of the happiest counties in the U.S. SmartAsset used a population filter, looking only at counties with populations of 50,000 or more. From there, we considered eight factors, some positive and some negative. Counties that had high levels of positive factors and low levels of negative factors did well in our study.
The positive factors were each county’s marriage rate, income ratio (the ratio of median income to cost of living), life expectancy and physical activity rate (the percentage of the population getting adequate physical activity each week). The negative factors were each county’s poverty rate, unemployment rate, divorce rate and personal bankruptcy rate.
For positive factors, a higher number was better and for negative factors a lower number was better. We ranked each county on each of the eight factors, giving each factor equal weight. Next, we averaged those rankings for each county.
From there we gave each county a score from 0-100 based on that average. (That’s the index in the chart below). The county with the best average received a score of 100 in our index. Below find our top 10 and top 25 happiest places in America.
Thinking of buying a home? Compare mortgage rates here.
Key Findings
- East Coast Beats West Coast. We’re not weighing in on East Coast vs. West Coast debate when it comes to hip hop, but seven of our ten happiest counties are in the East Coast. Only one Western county made the cut, and the rest were in the Midwest.
- Size doesn’t matter. The counties in our top ten list had populations ranging from 86,930 in Ozaukee, Wisconsin to 1,117,072 in Fairfax, Virginia. When it comes to the eight factors in our study, size isn’t everything.
- The Deep South needs to up its game. Only one Deep South county (Williamson, Tennessee) made our list of the top 25 happiest counties, and none cracked the top ten. The same was true in the 2015 edition of our happiest counties study.
- Marriage rate matters. All of the counties in our top 25 had marriage rates over 50% (the approximate average marriage rate in the U.S.). The relationship between marriage and prosperity goes both ways. Wealthy, educated people are more likely to get and stay married, and being married can also boost financial security and wealth (as long as you don’t have a financially irresponsible spouse).
- New Jersey gets a bad rap. Not one, not two but three New Jersey counties made our top ten. Maybe it’s time to reassess the Garden State’s reputation. Hunterdon, Morris and Somerset counties make a strong case for it. Property taxes in New Jersey may be high, but so, it seems, is morale.
Check out our budget calculator.
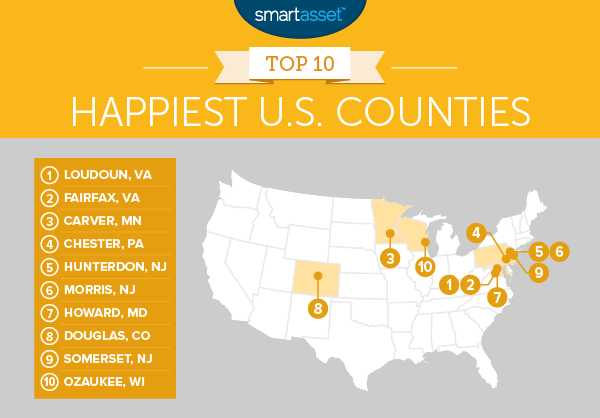
1. Loudoun County, Virginia
Loudoun County is #1 in our study for the second year in a row. What makes this such a happy place? For one thing, the unemployment rate and poverty rate are both under 4%. In fact, Loudoun’s poverty rate is the lowest of any county in our study.
Of the nearly 1,000 counties in our study, Loudoun County had the fourth-highest income ratio. Loudoun’s income ratio is over 2.5, which means the median income is more than twice the cost of living.
2. Fairfax County, Virginia
Next door to Loudoun County is the runner-up in our study, Fairfax County, Virginia. It’s one of just three counties in our study to have a life expectancy over 83 years.
The median income in Fairfax County is high, at $100,584. That’s a little under twice the national median income. The wealthy county also boasts a population that’s greater than that of eight states and the District of Columbia.
3. Carver County, Minnesota
Carver County, Minnesota falls within the Minneapolis-St. Paul-Bloomington Metropolitan Statistical Area. It boasts an income ratio of over 2.2, an unemployment rate under 4% and a marriage rate of 62.7%. With such a high quality of life, it’s not surprising that Carver County’s population has been growing. The Census estimates that Carver County’s population increased by over 8% between 2010 and 2015.
4. Chester County, Pennsylvania
Located in the greater Philadelphia area, Chester County boasts an income ratio of 2.3 and an average life expectancy over 80. It’s the highest-income county in Pennsylvania. No wonder its roughly 500,000 residents are a happy bunch.
5. Hunterdon County, New Jersey
New to the top ten in this year’s Happiest County’s study is Hunterdon County, New Jersey. Hunterdon has the fifth-highest median income of any county and an income ratio of over 2.4. If that’s not enticement enough, Hunterdon County is also home to Northlandz, the world’s largest model railroad.
6. Morris County, New Jersey
Next up on our list is Morris County, New Jersey. It’s home to the headquarters of some major corporations, including Avis Budget Group and Honeywell International. Morris County also boasts the third-highest median income of any New Jersey county.
7. Howard County, Maryland
Howard County, Maryland is a prosperous corner of the country that boasts some of the nation’s highest-rated public schools. Its median income of $110,133 is the fourth-highest in our study and its income ratio of 2.58 is the third-highest.
8. Douglas County, Colorado
Douglas County, Colorado is booming. According to the Census, the county’s population grew 12.9% between 2010 and 2015. Douglas County has the highest income ratio of any county in our study (2.7), and the eighth-highest median income, at $102,626. It’s a physically active county, too, with 68.75% of residents getting adequate physical activity.
9. Somerset County, New Jersey
The third Garden State county on our list is Somerset County. It boasts the ninth-highest median income in our study and an average life expectancy of 82. Somerset County was formed in 1688 and is home to numerous sites on the National Register of Historic Places.
10. Ozaukee County, Wisconsin
Ozaukee County, Wisconsin has the second-highest physical activity rate of any of the counties in our top ten, with 63.6% of residents getting adequate physical activity. We’re guessing the county’s proximity to beautiful Lake Michigan helps inspire residents to get out and about.
Find out now: Is it better to rent or buy?
Methodology
To rank our counties by the eight factors we considered, we pulled data from several sources. To eliminate counties with fewer than 50,000 residents we used population data from the Census Bureau’s American Community Survey (ACS) for 2009-2014.
Our data for life expectancy and physical activity rate came from the Institute for Health Metrics and Evaluation’s healthdata.org. Personal bankruptcy filings data came from uscourts.gov.
To calculate the income ratio we used data for both cost of living and median income. Cost of living data came from MIT’s Living Wage Calculator. We used the living wage income for two adults and one child as the cost of living baseline. We then took median income data from the Census Bureau’s 5-year American Community Survey (2009-2014). We divided median income by cost of living to get the income ratio for each county.
Divorce rates and marriage rates also came from the Census Community Survey for 2009-2014, as did the poverty rate. To get an unemployment rate that reflected the recovery from the recession we used the Bureau of Labor Statistics’ Local Area Unemployment Statistics for February 2016.
We combined all eight factors, giving them equal weight. We set a minimum population 50,000, the same minimum used in last year’s study. We further narrowed the scope by eliminating counties that didn’t have data for all eight factors, leaving us with 981 counties.
We ranked each county on each factor and then gave each county an average rank based on those eight factors. We applied a score between 0 and 100 based on that average ranking. The highest-ranking county got a score of 100 and the lowest-ranking county got a score of 0.
Questions about our study? Contact blog@smartasset.com.
Photo credit: ©iStock.com/Portra