 Written by
Owning a home is usually considered part of living the American Dream. But becoming a homeowner is neither easy nor affordable for everyone. Even if you manage to make the leap to homeownership, having a house of your own could seem burdensome if you’re stuck with high property taxes and insurance costs. Moreover, as a homeowner, many factors that affect the real estate market – including interest rates and the economy – are entirely out of your control.
This is SmartAsset’s second annual study of the best states for homeowners. Read 2015’s study here.
SmartAsset wanted to rank the best states in America for homeowners. To complete our analysis, we considered nine different factors.
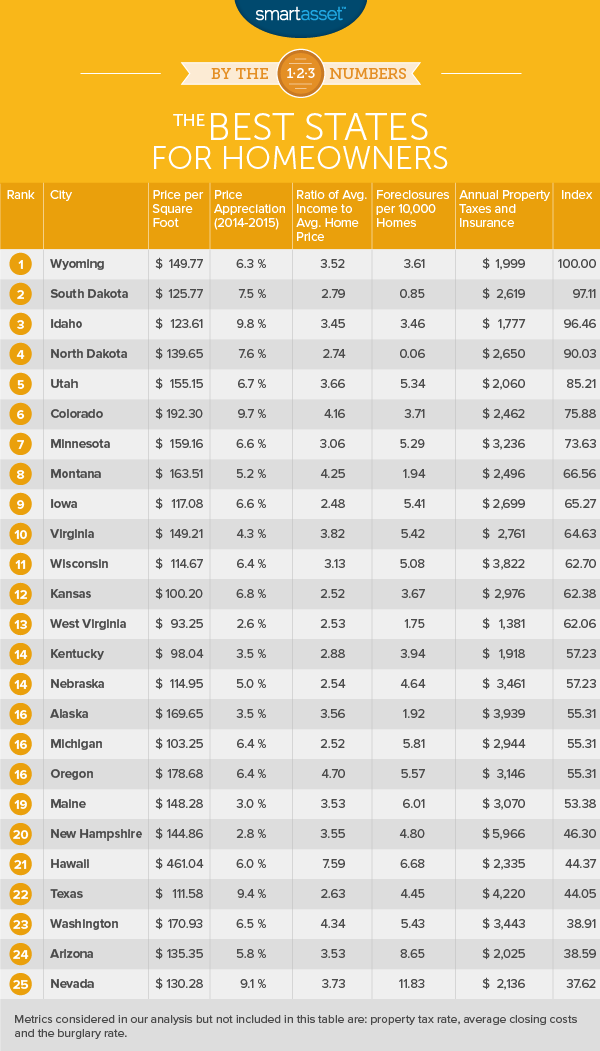
We ranked all 50 states based on factors including foreclosure rates, burglary rates and property tax rates. We also looked at the median listing price per square foot, the annual change in home prices (per square foot), home affordability and the annual cost of property taxes and homeowners insurance. (Read more about our full methodology below.)
Try SmartAsset’s free mortgage calculator.
Key Findings
- Watch out for Wyoming. For the second year in a row, Wyoming ranks as the state with the best environment for homeownership.
- The cost of homeownership is high in the Northeast. Owning a home can be expensive in places like Massachusetts and New York. When you consider that states like New Jersey and Connecticut have double-digit foreclosure rates and high housing costs, buying a home in this region might seem like a risky move.
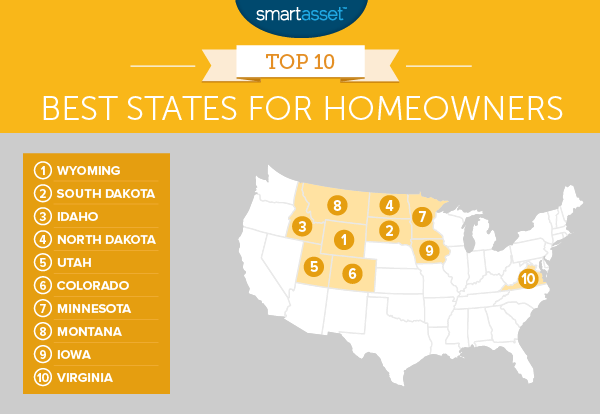
1. Wyoming
Thanks to its relatively low property tax rate and low average closing costs, many folks in the state of Wyoming can afford to own a home.
Wyomingites enjoy quite a few perks, including clean air and gorgeous views. And with an average burglary rate of 289.1 per 100,000 people, residents barely need to worry about someone breaking into their homes.
2. South Dakota
If you own a home, you generally want its value to increase over time. That way, you can build equity and hopefully sell your house one day for a nice chunk of change.
Home values in South Dakota are on the rise. In 2015, the home price per square foot went up by 7.5%. In our 2015 analysis, we saw the home price per square foot appreciate by 6.3%. Data from the U.S. Census Bureau shows that the median home value in the state is still only $142,300.
3. Idaho
Conditions for homeowners in Idaho have improved since last year. In 2015, home prices increased by 9.8% on a per-square-foot basis, making Idaho the state with the highest rate of price appreciation. In 2014, home prices per square foot only increased by 1.7%.
Homeowners in the Gem State might also be happy to know that foreclosure and burglary rates have declined since 2015 by 31.5% and 12.7%, respectively. Annually, property taxes and insurance cost just $1,777. That means homeowners in Idaho pay less than their counterparts in all but three states.
4. North Dakota
North Dakota has the lowest foreclosure rate in America. Data from RealtyTrac shows that as of May 2016, there was only one foreclosure for every 162,356 homes. While that’s certainly something to celebrate, falling oil prices could cause problems for the housing market in the state. We will watch the foreclosure rate to see how it is impacted, as well as North Dakota’s overall ranking in next year’s study.
5. Utah
If you’re looking for an affordable place to purchase a home, you might want to consider moving to Utah. On average, homeowners in Utah pay fewer closing costs than those in all but three U.S. states. The cost of homeowners insurance remains low as well and it hasn’t changed since we last conducted our study in 2015. Folks who own homes pay just $580, on average, each year to protect their property.
6. Colorado
In our latest study on the best housing markets for growth and stability, three Colorado metro areas ranked in the top 10. Based on the data we pulled for this analysis, we concluded that Colorado as a whole was a great place for people wanting to own homes. The state’s average effective property tax rate (0.58%) is among the lowest rates in the nation. Plus, it has the second highest rate of home price appreciation (per square foot).
Related Article: The Cost of Living in Colorado
7. Minnesota
Minnesota ranks as the seventh best state for homeowners in 2016. While it didn’t rank as well as it did in our 2015 study, it still ended up in the top 10. In 2015, the home price per square foot climbed by 6.6% and the average price of a home is now just over three times the median household income.
In addition to its relatively healthy housing market, the state of Minnesota has a relatively low unemployment rate of 6.5%, according to 2014 data from the U.S. Census.
8. Montana
Montana is one of the least densely populated states in the country. Recent data from the Census Bureau says that there are only 6.8 people per square mile. If you prefer to have plenty of breathing room, living in Montana might not sound like such a bad idea.
According to RealtyTrac, the state’s foreclosure rate is fairly low (there’s one foreclosure for every 5,142 homes). What’s more, its average effective property tax rate is 0.84%. That means that tax rates for Montanans are on average lower than those for their neighbors in North Dakota and South Dakota.
9. Iowa
According to 2014 data from the U.S. Census Bureau, there are over 3 million
people living in the state of Iowa. With a median home value of $133,100, the average home in the Hawkeye State costs 2.5 times the median income.
Census Bureau data also reports that just 22.4% of homeowners with mortgage debt are cost burdened, meaning that they spend at least 30% of their household income on housing costs.
On a national level, 2015 data from the Joint Center for Housing Studies of Harvard University shows that over 25% of homeowners spent more than 30% of their income on housing-related expenses.
Related Article: The Most and Least Severely Housing Cost-Burdened Cities
Related Article: 529 Plans in Iowa
10. Virginia
In our ranking of the best states for homeowners, Virginia was the only state on the east coast to make it into the top 10 in both 2015 and 2016. The ratio of the state’s median home price to its median income (3.82) hasn’t changed since last year, but our analysis shows that its foreclosure rate and burglary rate have fallen.
Related Article: 529 Plans in Virginia
Methodology
We wanted to provide a comprehensive assessment of the environment for homeowners in each state. So we ranked all 50 states using nine different metrics.
In terms of housing affordability, government standards say that households should spend no more than 30% of their income on housing-related expenses. In order to measure home affordability in each state, we used two factors: average closing costs and the ratio of each state’s median home value to its median household income. We gave half-weight to the closing costs and full weight to the affordability ratio (assuming that a lower affordability ratio and lower closing costs are better for homeowners).
In order to look at the cost of owning a home in all 50 states, we gave half-weight to the following factors: property tax rates, median annual property taxes paid and the average annual cost of homeowners insurance. Since safety is an important factor for homeowners as well, we gave full weight to our burglary rate factor (the average rate per 100,000 people).
Finally, we gave full weight to three factors that provided insight into the status of the housing markets in each state. We found the average number of foreclosures per 10,000 homes. And considering that a homeowner could eventually sell their house, we found the median listing price per square foot and the annual change in that price between 2014 and 2015 (we assumed that for each of these last two factors, a higher value was better for homeowners).
To complete our analysis, we ranked each state based on our nine metrics and averaged those rankings. Each state received a score from 0 to 100 based on the averages, with the best state for homeowners receiving a 100 and the state with the lowest overall average receiving a 0.
Sources
Data on average closing costs comes from Bankrate. Foreclosure rate data comes from RealtyTrac and burglary rates come from the FBI. Data on the price per square foot in each state and the annual change in those prices comes from Zillow.
We used data from the U.S. Census Bureau to look at property tax rates and to calculate the median ratio of home values to median income. Homeowners insurance costs come from ValuePenguin.com.
The data analysis for this study was completed by Nick Wallace.
This is the 2016 version of our study of the best states for homeowners. Read the 2015 version.
Questions about our study? Contact us at blog@smartasset.com.
Photo credit: ©iStock.com/slobo