 Written by
Housing policies at the state level can have a significant impact on homeowners. State regulations regarding taxes, insurance and mortgage lending affect home prices and the costs of ownership. Likewise, the economic conditions in a given state can have a profound impact on local housing markets.
This is the 2015 version of SmartAsset’s study. Read the 2016 version here.
Take, for example, North Dakota. Last decade, while the rest of the country suffered through a foreclosure crisis, North Dakota’s cities remained unscathed, buoyed by the state’s strong economy.
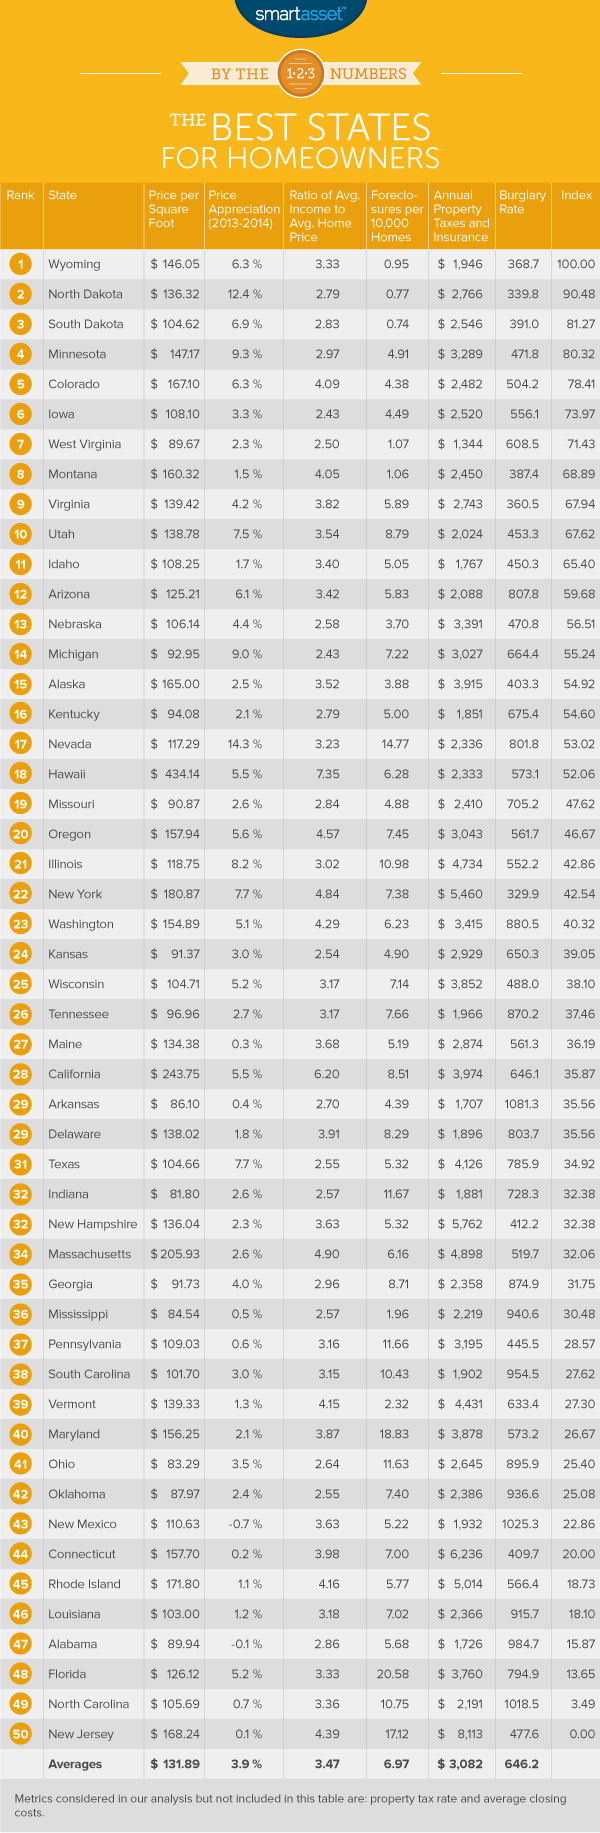
So which states have the best environment for homeownership? To answer that question, SmartAsset looked at nine different metrics reflecting the costs and benefits of homeownership across all 50 states. We took a holistic view of housing in each state, taking into consideration everything from property taxes to foreclosure rates to affordability. (Read more about our methodology below.)
Try SmartAsset’s free mortgage calculator.
Key Findings of the Best States for Homeowners
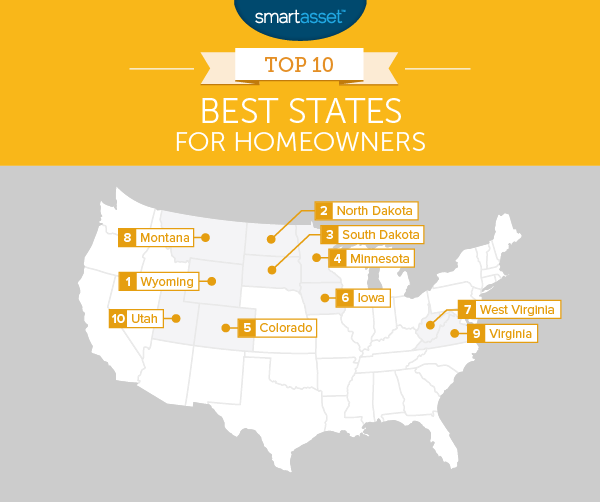
- Happy homeowners in the Great Plains and Upper Midwest. As the map below demonstrates, most of the best states for homeowners are clustered in the Upper Midwest and Great Plains, led by Wyoming, North Dakota and South Dakota.
- New Jersey is dead last for homeowners. Thanks to its sky high property taxes, sluggish growth rates and high foreclosure rate, New Jersey ranks as the worst state for homeowners. That doesn’t mean there aren’t good areas to own a home in New Jersey, but by and large the Garden State does little to make homeownership easy or affordable.
Wyoming
With the lowest population density of the 48 contiguous states, Wyoming is known for its vast open spaces and breathtaking scenery. Homeowners in the state get to enjoy lovely views, along with the best conditions for homeownership to be found anywhere in the U.S. Wyoming has the third lowest foreclosure rate in the country and the eighth lowest property tax rate. Housing prices in the Cowboy State have grown steadily over the past few years, with the price per square foot appreciating by 6.3% in 2014, according to Zillow.
North Dakota
If price appreciation in Wyoming has been steady in recent years, in North Dakota it has been explosive. 2014 saw home prices increase by 12.4% on a per-square-foot basis in North Dakota, the second highest rate of any U.S. state.
Those rates are expected to slow in the near future, but in the meantime homeowners are continuing to see their investment grow. North Dakota is also among the safest states for homeowners. The state’s average burglary rate of 339.8 per 100,000 people is the second lowest in the U.S.
South Dakota
Foreclosures are bad for homeowners on a number of levels. First and foremost is the devastating effect of a foreclosure on the homeowner and the homeowner’s family. But foreclosures also affect neighbors as foreclosed homes depress home prices and can alter the housing market of an entire city, as was the case in many parts of the country during the foreclosure crisis of 2009.
That is not as much of an issue in South Dakota, which has the lowest foreclosure rate of any U.S. state. According to RealtyTrac, there was just one foreclosure for every 13,544 homes in South Dakota as of August 2015.
Minnesota
Sixty percent of the population of Minnesota lives in the Minneapolis-St. Paul metropolitan area. That area has seen steady price growth over the past few years, with median home sales prices increasing from an average of $171,800 in 2012 to $210,100 in 2014. As of the second quarter of 2015, they had reached $229,200, almost exactly equal to the national median. That’s great news for homeowners who have a mortgage, as if your home is worth more than your mortgage amount, you have a higher net worth.
Colorado
Property taxes vary wildly between states. New Jersey has the highest property tax rates in the country, with property taxes annually costing homeowners about 2.2% of their home’s value on average. So if you have a $200,000 home in New Jersey, on average you would pay $4,400 annually.
Colorado lies at the other end of the spectrum, with an average effective rate of just 0.63%, ninth lowest in the U.S. If that same homeowner owned a $200,000 house in the Rocky Mountain State, she could expect annual taxes to be closer to $1,260.
Iowa
Among the financial risks that come with homeownership is the possibility that a so-called “act of God” will damage or destroy your home. Homeowner’s insurance mitigates this risk and the rates on that insurance are reflective of the likelihood of such a disaster. The state with the highest insurance rates is Florida, where hurricanes have the potential to do billions in property damage every year.
Iowa, on the other hand, enjoys relatively benign weather and, therefore, low homeowner’s insurance rates. The average Iowan homeowner spends $734 annually on insurance, the tenth lowest amount of any state. In contrast, the Floridian average is $1,991.
Related Article: 529 Plans in Iowa
West Virginia
West Virginia ranks as the third most affordable state for housing in the U.S. The average home in the Mountaineer State costs just 2.5 times the median income. At the same time, however, the state’s housing market remains relatively healthy. Its foreclosure rate of one foreclosure for every 9,372 homes is the fifth lowest in the country.
Montana
Montana is the fourth largest state (by area) in the country. Destinations like Glacier National Park and the National Bison Range make it a popular choice for travelers but Montana’s residents are surrounded by the state’s natural wonder year round. Homeowners in Montana also enjoy high levels of security, in more than one sense. The state has the fourth lowest foreclosure rate of any U.S. state. It also has the fifth lowest burglary rate, with just 387.40 burglaries for every 100,000 residents.
Virginia
The only coastal state to crack the top 10, Virginia rated in the top half of all states for seven of the nine factors we considered. Homeowners in the state face fairly different prices depending on the region in which they live. In the greater Washington D.C. metro area, average home prices exceed $400,000, according to the National Association of Realtors. In contrast, home prices in the Virginia Beach area are closer to $200,000. Inland, in cities like Roanoke, prices are even lower.
Related Article: 529 Plans in Virginia
Utah
The average effective property tax rate in Utah is just 0.68%. This is the 10th lowest of any U.S. state. One reason rates are so low is that the state provides a tax exemption of 45% on all residential property, which in effect means that just 55% of a home is subject to property taxes. That adds up to big annual savings for homeowners in Utah and is one reason it ranks as a top ten best state for homeowners.
Data & Methodology
To measure the costs and benefits of homeownership, SmartAsset looked at nine metrics covering a number of different aspects of owning a home. We considered common annual expenses: property tax rates, property taxes paid and the cost of insurance.
We gave half-weight to each of these factors. We also looked at two measures of affordability: the ratio of the median home price to the median income in the state and the average closing costs. We gave full weight to the affordability ratio and half-weight to the average closing costs.
Next, we wanted to gauge general market conditions. To do so we looked at three metrics: the price per square foot of housing in the state (to measure the value a homeowner would receive if she decided to sell), the annual appreciation of home prices from 2013 to 2014 and the state’s average foreclosure rate.
Lastly, we collected data on the burglary rate in each state in order to measure the likelihood that homeowners would be the victim of a property crime.
We ranked each state according to these nine factors and then averaged those rankings. We applied scores from 0 to 100 based on those averages. The state with the best overall average received a 100, while the last-ranked state received a 0.
Data on prices per square foot and home appreciation comes from Zillow. Data on the ratio of median home values to median income comes from the U.S. Census Bureau, as does data on property taxes. Data on average insurance costs comes from ValuePenguin.com and data on closing costs comes from Bankrate. Data on the average foreclosure rate in each state comes from RealtyTrac and data on the average burglary rate comes from the FBI.
Read the 2016 version of SmartAsset’s study of the best states for homeowners.
Questions about our study? Contact us at blog@smartasset.com.
Photo credit: ©iStock.com/Adventure_Photo