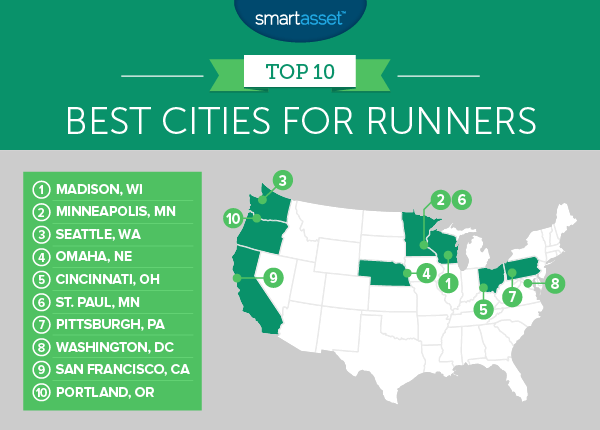
Running is more than a way to stay in shape. Sure, it’s great exercise, but runners also run as a way to explore new places, to test their limits and even participate in races to raise money for charity. Although running is one of the more accessible sports, not all cities are equal when it comes to what they offer to runners. Some cities give runners the choice to run through parks, on trails or at the gym. Others give runners more chance to push themselves with year-round races.
Find out now: How much house can I afford?
Study Specifics
SmartAsset looked at these and other factors to find the best cities for runners in the United States. We gathered data related to running outdoors, like acres of parkland per 1,000 residents and percentage of a city which is comprised of parkland. Then we looked at data concerning running in the city, like the city’s walkability and the number of pedestrians killed in vehicular accidents. We also looked at the number of gyms per 10,000 residents in the city to account for those runners who like to run on treadmills and the number of races per 10,000 residents for runners with a competitive streak. Finally, as a measure of affordability, we looked at average percent of income which goes to housing.
Key Findings
- Twin Cities – Minneapolis and St. Paul both cracked our top 10 for best cities for runners. Working in their favor is the fact that Minnesota has the lowest pedestrian fatality rate in the United States.
- The Midwest is for runners – Half of the cities in the top 10 are located in the Midwest.
- Arizona, not so much – Four out of the top 10 worst cities for runners are located in Arizona. These cities, Glendale, Gilbert, Mesa and Chandler, were hurt by the lack of parks and poor walkability scores.

1. Madison, Wisconsin
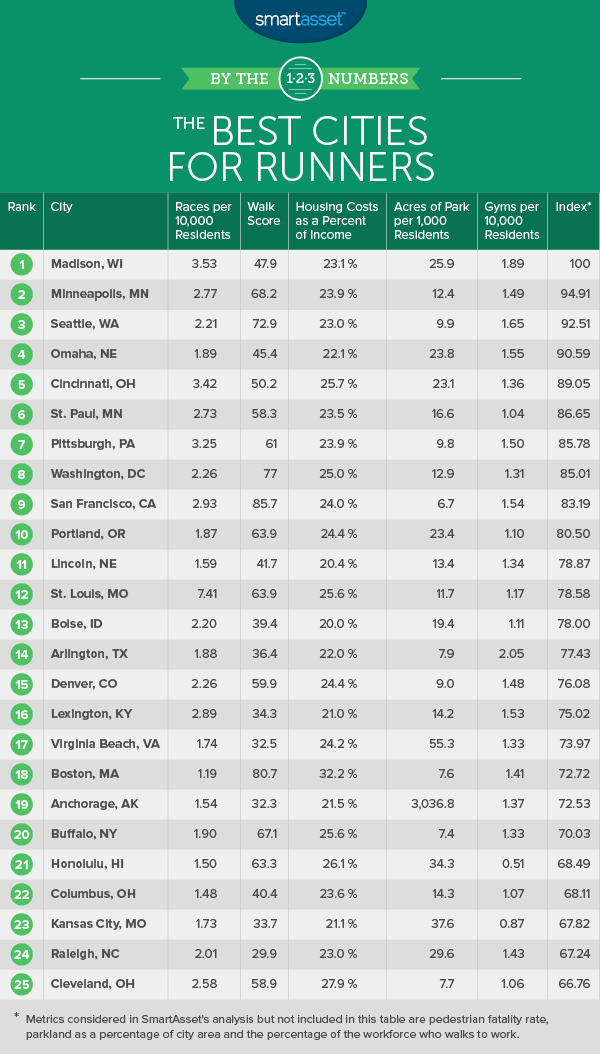
Madison takes first place in our study of the best cities for runners. This city combines frequent races with a large number of gyms to make it a great fit for people who love running. Madison is home to around 88 races annually – or 3.53 races per 10,000 residents. The city also has about 59 gyms (or 1.89 gyms per 10,000 residents). It ranks in the top 5 for both these metrics. Mad City also scores in the top 10 in two other metrics: pedestrian safety and percent of the population who walk to work.
2. Minneapolis, Minnesota
Minneapolis ranks as the second-best city for runners. The City of Lakes comes equipped with 1.48 gyms per 10,000 residents, the 11th-highest rate in the study. This is important to note as winter temperatures in Minneapolis may deter all but the most committed runners from heading outdoors regularly. The average temperature in January, for example, is 15 degrees. Despite the frigid temperatures, Minneapolis residents are still treated to a bevy of winter race options, including the Everybody’s Irish 5k & 10k which takes place on St. Patrick’s Day. Overall, Minneapolis ranks 10th for races per 10,000 residents.
3. Seattle, Washington
Seattle is a great running city, especially for runners who prefer running on the streets or in gyms. The Emerald City ranks 5th for gyms per 10,000 residents and 10th for walkability. However in terms of park acres per 1,000 residents, Seattle lags a bit behind other cities. Seattle only has 9.9 park acres per 1,000 residents. That’s the 37th-lowest rate in the study. But if you want to skip the park and run to work instead, you’ll be in good company in Seattle. It has the sixth-highest rate of residents walking to work.
4. Omaha, Nebraska
Of all the cities in the top 10, Omaha offers the best chance to run in Mother Nature. Omaha has 23 acres of parkland per 1,000 residents, the highest rate in the top 10. Over 13% of the city consists of parks. Omaha also has the 6th-most gyms per 10,000 residents in our study. All of the parks and gyms may be greatly appreciated since Omaha isn’t a walkable city. Just 2.5% of the workforce walk to work. Omaha is also the most affordable city in the top 10 when it comes to housing. On average about 22% of household income goes toward housing costs here.
5. Cincinnati, Ohio
Do you have a competitive streak? Cincinnati offers a lot of options for races. The city has the 5th-most races per 10,000 residents in our study, including the famous Cincinnati Flying Pig Marathon. Prefer to get your workout on a treadmill? Cincinnati has 1.36 gyms per 10,000 residents, the 18th-most in the study. Plus, over 14% of the city is covered by parkland.
6. St. Paul, Minnesota
The second member of the Twin Cities, St Paul, comes in sixth. St. Paul shares much in common with its neighbor to the west. Both are safe for pedestrians, have a number of races and a pretty good walk score. St. Paul ranks 26th or better in each of those metrics. The reason Minneapolis is second and St. Paul is sixth is access to gyms. St. Paul ranks 47th for gyms per 10,000 residents while Minneapolis ranks 11th.
7. Pittsburgh, Pennsylvania
Pittsburgh is in the top 10 partly due to its walkability. According to walkscore.com, Pittsburgh is the 23rd-most walkable city in the study. If you are the type of person who enjoys an early morning run to work, Pittsburgh may be a good place for you. Around 11% of the workforce here walk to work. Pittsburgh is also a great city to try and push your limits. There are about 100 races each year (3.25 races per 10,000 residents), the sixth-most in the study.
8. Washington, D.C.
The nation’s capital ranks eighth on our list of the best cities for runners. Washington, D.C. is the ninth-most walkable city in our study and a whopping 12.8% of the workforce heads to the office on foot. Thanks in part to the National Mall, it also has plenty of green space. Over 20% of Washington, D.C. is covered by park, but the parks may be on the crowded side. D.C. only ranks 51st for acres of park per 1,000 residents. For indoor running, Washington D.C. is also a good city. It has 1.3 gyms per 10,000 residents, the 23rd-best in the country.
9. San Francisco, California
San Francisco is a similar running city to Washington D.C. Both cities have a large number of parks but thanks to high population densities the parks can get crowded. For example, 18% of San Francisco is made up of parks, but there are only six acres of parks per 1,000 residents. As a comparison, residents of Las Vegas have close to eight acres of parkland per 1,000 residents, but only 5.5% of Las Vegas is made up of parks. Despite the relatively crowded nature of the parks, SF is good city for runners. It’s the third-most walkable city in the study and has the seventh-most races per 10,000 residents, with more than 250 races each year.
10. Portland, Oregon
Portland, Oregon rounds out our list of the best cities for runners. This city holds off other competitors outside the top 10 due to its consistently solid scores. In all metrics save one, Portland ranks in the top half. Rip City’s best scores come in the two park-related metrics. Portland ranks 16th for parkland as a percentage of the city area and 29th for acres of parkland per 1,000 residents.

Data and Methodology
In order to find the best cities for runners, we looked at 100 of the largest cities in the country. Specifically we looked at the following eight metrics:
- Acres of parkland per 1,000 residents. This metric measures relative access to parks. Data comes from the Trust for Public Land and is from 2015.
- Parkland as a percentage of city area. This metric measures how much of a city’s area is taken up by parkland. Data comes from the Trust for Public Land and is from 2015.
- Number of gyms per 10,000 residents. Population data comes from the U.S. Census Bureau’s 2015 1-Year American Community Survey. Data on gyms comes from the U.S. Census Bureau’s 2014 Business Patterns Survey.
- Pedestrians fatality rate per 100,000 residents. This is the number of pedestrians killed in vehicular accidents per 100,000 residents. Data comes from National Highway Traffic Safety Administration and is from 2014. It is measured at the state level.
- Races per 10,000 residents. Data comes from runningintheusa.com and contains data on races of all types of distances, including marathons, half marathons, 10ks, 5ks and trails races.
- Walk score. This metric measures how walkable a city is. Data comes from walkscore.com
- Housing costs as a percent of income. This metric measures a city’s affordability. Data on median housing costs comes from the U.S. Census Bureau’s 2015 1-Year American Community Survey. Data on median household incomes comes from the U.S. Census Bureau’s 2015 1-Year American Community Survey.
- Percentage of workforce who walks to work. Data comes from the U.S. Census Bureau’s 2015 1-Year American Community Survey.
We ranked each city across each of the eight metrics giving a single weighting to all metrics except parkland as a percentage of city area which received a half weight. After, we averaged those rankings. We applied a score based on the average rankings. The city with the highest average ranking received a 100 while the city with the lowest average ranking received a 0.
Questions about our study? Contact us at press@smartasset.com.
Photo credit: ©iStock.com/zoranm