Healthcare is one of the fastest-growing expenditures in the country. Nationwide healthcare costs reached over $10,000 per person in 2016 and that figure’s expected to grow at a 5.8% clip until 2025, according to a report in the Health Affairs journal. One way to keep those costs down is to take care of your health. Of course many illnesses and health issues are unavoidable, but behaviors like regular physical activity and abstaining from tobacco use are good ways to avoid unwanted trips to the doctor’s office.
Thinking about buying a home? See what your mortgage payment will be with SmartAsset’s mortgage calculator.
In order to find the healthiest cities in the United States, we looked at data on obesity rates, smoking rates, physical inactivity rates, excessive drinking rates and the percent of the population who has health insurance. Read our data and methodology section below for more details on how we put the study together.
Key Findings
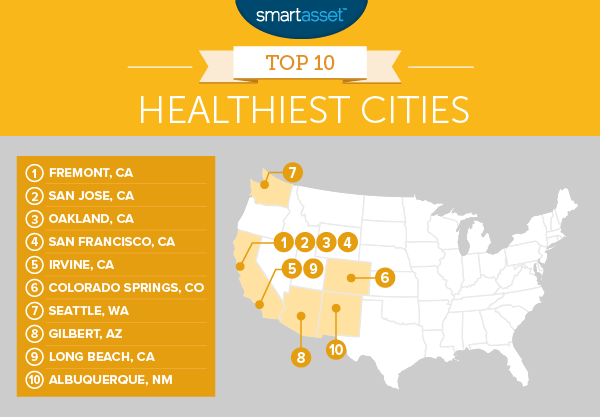
- Healthy California – Maybe it is the year-round sunshine encouraging people to get outside or all the physical activities, like surfing and hiking, available to residents but for whatever the reason, California takes six out of the top 10 spots. The Bay Area in particular has a population engaging in healthy behavior. Fremont, Oakland, San Francisco and San Jose all claim spots in the top 5.
- High obesity rates in the South – Seven of the bottom 10 cities in this study are in the South. Part of the reason is the high obesity rates in the region. Cities like New Orleans, Baton Rouge, Louisiana and Corpus Christi, Texas, for example, have obesity rates in excess of 32%. That means almost one in every three people in those cities are obese.

1. Fremont, California
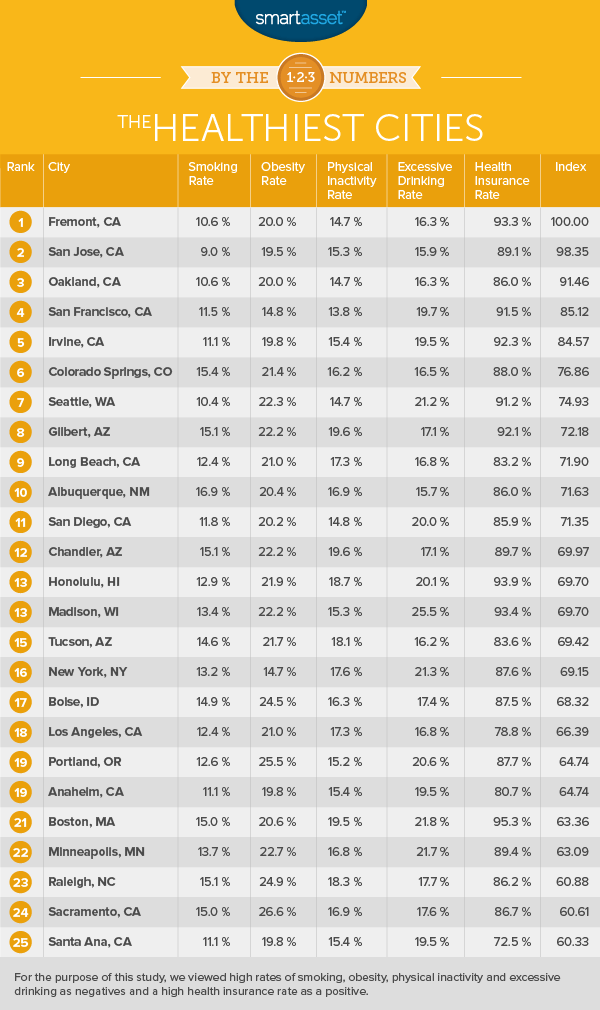
Fremont takes first place in our study of healthiest cities. This Bay Area suburb with a population of 230,000 has top five scores in three different metrics. Specifically, it has the fifth-highest health insurance rate (93%), third-lowest smoking rate (10.6%) and third-lowest physical inactivity rate (14.7%). With the Don Edwards National Wildlife Refuge, Mission Peak Regional Reserve and the Coyote Hills Regional Park all relatively close by, it isn’t too surprising that Fremont residents are active during their leisure time.
2. San Jose, California
The Capital of Silicon Valley comes in just behind Fremont. San Jose has an even lower smoking rate than Fremont: only 9% of adults in San Jose smoke compared to Fremont’s 10.6%. However, the lower percent of people in San Jose with health insurance is what drops the city down the ranking. About 89% of San Jose residents have health insurance. Certainly a high number but not enough to take the top spot. Overall, the city contains 15,950 acres of parkland within the city limits. According to the Trust for Public Land, San Jose has the 11th-best park system in the country, so there’s no excuse to not get out and about. Just 15.3% of the city’s adult population report that they don’t engage in physical activity for leisure.
3. Oakland, California
Oakland, California claims the third spot in our ranking of the healthiest cities. Residents in Oakland are some of the most active during their leisure time. Only 14.7% of Oakland adults report doing no physical activity during leisure time. One thing dragging Oakland down the rankings however, is its health insurance rate. Only 86% of Oakland residents have health insurance. That number is lower than the national average of 87%, according to Census Bureau data.
4. San Francisco, California
San Francisco finishes behind its Bay Area neighbors. It has top 10 scores in four out of our five metrics, including the second-lowest obesity rate in the study. Just 14.8% of people in SF are obese. Only New York has a lower rate. So why didn’t the City by the Bay finish higher? Too much alcohol. San Francisco residents have one of the worst incidents of excessive drinking in the study. Almost 20% of adults meet the criteria for engaging in excessive drinking.
5. Irvine, California
Irvine, a Southern California city which we found is one of the most livable cities in America, takes the fifth spot. San Francisco and Irvine share a few traits in common when it comes to healthy behaviors. Like San Francisco, the obesity rate in Irvine is low: less than 20% of Irvine adults are obese. Plus, a whopping 92% of people in Irvine have health insurance. That rate is the second-highest in the top 10 and is similar to SF’s 91.5%. However both cities took a hit when it comes to excessive drinking. More than 19% of adults in Irvine engage in excessive drinking. It ranks 69th in that metric.
6. Colorado Springs, Colorado
Colorado Springs residents are some of the most active in the country. Over 84% of adults here report doing some physical activity during their leisure time. Makes sense with the Garden of the Gods, a national landmark, right in their backyard. The park offers lots of hiking, rock climbing and mountain biking opportunities. About 16% of adults in Colorado Springs engage in excessive drinking. That’s the fourth-lowest rate in the top 10.
7. Seattle, Washington
Despite being one of the hardest-working cities in the country, Seattle residents still find time to get up and move around. Seattle has the third-lowest rate of physical inactivity at 14.7%. Unfortunately for their overall health, people here seem to enjoy their alcohol. Over 21% of Seattle adults engage in excessive drinking. Seattle ranks 86th in that metric.
8. Gilbert, Arizona
Gilbert is the lone representative from the Grand Canyon State in the top 10. The city’s residents should take pride in the high health insurance rate. Over 92% of residents here have health insurance. That’s the third-highest rate in the top 10. But Gilbert didn’t rank higher overall in part due to its physical inactivity rate. Close to 20% of adults in Gilbert report that they engage in no physical activity for leisure. That’s the worst rate in the top 10.
9. Long Beach, California
Long Beach residents have relatively low smoking and excessive drinking rates. Around 12% of Long Beach adults smoke and 16.8% report excessive drinking. For both these measures Long Beach ranks in the top 25. However the city took a major hit when it comes to health insurance. Only 83% of residents have health insurance. That’s the lowest rate in the top 10.
10. Albuquerque, New Mexico
Albuquerque is the only city in our top 10 where the percent of adults who smoke is higher than the percent of adults who engage in excessive drinking. In fact Albuquerque has one of the worst scores for smoking. It ranks 65th in that metric. Close to 17% of Albuquerque adults smoke. The city makes up for it a little with its excessive drinking rate. Less than 16% of adults engage in excessive drinking. That’s the best rate in the top 10 and 13th-best in the entire study. Plus, the city has the 13th-lowest obesity rate in the study.

Data and Methodology
In order to rank the healthiest cities in the United States, we gathered data on 98 of the largest cities in the country and ranked them across five factors. Specifically we looked at:
- Physical inactivity rate. This is the percentage of adults over the age of 20 who report no physical activity for leisure. This is self-reported so it could include anything from going to the gym, hiking, golfing or walking your dog. Data comes from countyhealthrankings.org.
- Smoking rate. This is the percentage of adults who currently smoke or have smoked at least 100 cigarettes in their lifetime. Data comes from countyhealthrankings.org.
- Obesity rate. This percentage of adults over the age of 20 who report a BMI greater or equal than 30. Data comes from countyhealthrankings.org.
- Excessive drinking rate. This is the percentage of adults who consumed more than four alcoholic drinks for women or five alcoholic drinks for men on a single occasion in the past 30 days, or who engaged in heavy drinking, which is defined as more than one alcoholic drink for women or two alcoholic drinks for men per day. Data comes from countyhealthrankings.org.
- Health insurance rate. This is the percentage of the overall population with health insurance. Data comes from the U.S. Census Bureau’s 5-Year American Community Survey.
We ranked each city across each of the five metrics, weighting all five metrics equally. For the purpose of this study, we viewed high rates of physical inactivity, smoking, obesity and excessive drinking as negatives and a high health insurance rate as a positive. We then found the average ranking for each city. After, we gave each city a score based on its average ranking. The city with the best average ranking received a score of 100 and the city with the worst average ranking received a score of 0.
Questions about our study? Contact us at press@smartasset.com.
Photo credit: ©iStock.com/vgajic
