 Written by
With mortgage rates falling and a renewed emphasis put on living space during COVID-19, U.S. home sales have boomed. Data from the National Association of Realtors shows that sales of previously owned homes increased by 20.7% over the month of June and rose an additional 24.7% during July. Meanwhile, based on the Census’ Survey of Construction, sales of new homes increased by 15.1% and 13.8% during June and July, respectively.
With homeownership becoming increasingly popular, SmartAsset examined the data to find the best states for homeowners. We compared all 50 states across 10 metrics: median price per square foot, home value appreciation, ratio of home value to income, foreclosures per 10,000 homes, average annual homeowners insurance, burglary rate, median annual property taxes, effective property tax rate, average closing costs and average closing costs as a percentage of median home value. For details on our data sources and how we put all the information together to create our final rankings, check out the Data and Methodology section below.
This is SmartAsset’s sixth annual study on the best states for homeowners. The 2019 version can be found here.
Key Findings
- Strong showings in the West and Northeast. Half of the top 10 states in our study are located in the West, while an additional three are part of the Northeast. Homes appreciated by more than 5% over the past year in all five Western states – Wyoming, Idaho, Utah, Arizona and Washington. Meanwhile, all three Northeastern states – New Hampshire, Massachusetts and Maine – rank within the top 15 of the study for their low estimated cost of homeowners insurance and within the top five of the study for their low burglary rates.
- Massachusetts moves up. Massachusetts did not rank in the top half of states for homeowners in last year’s study, but it ranks sixth this year. First, the foreclosure rate dropped from 3.01 per 10,000 homes to 0.10 per 10,000 homes. In addition, the average cost of homeowners insurance in the state fell by about $150.
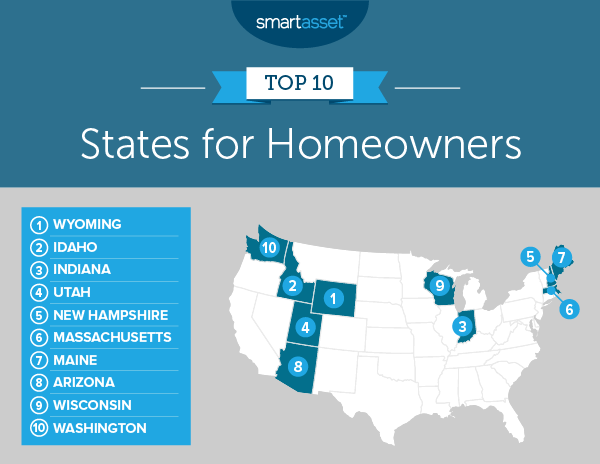
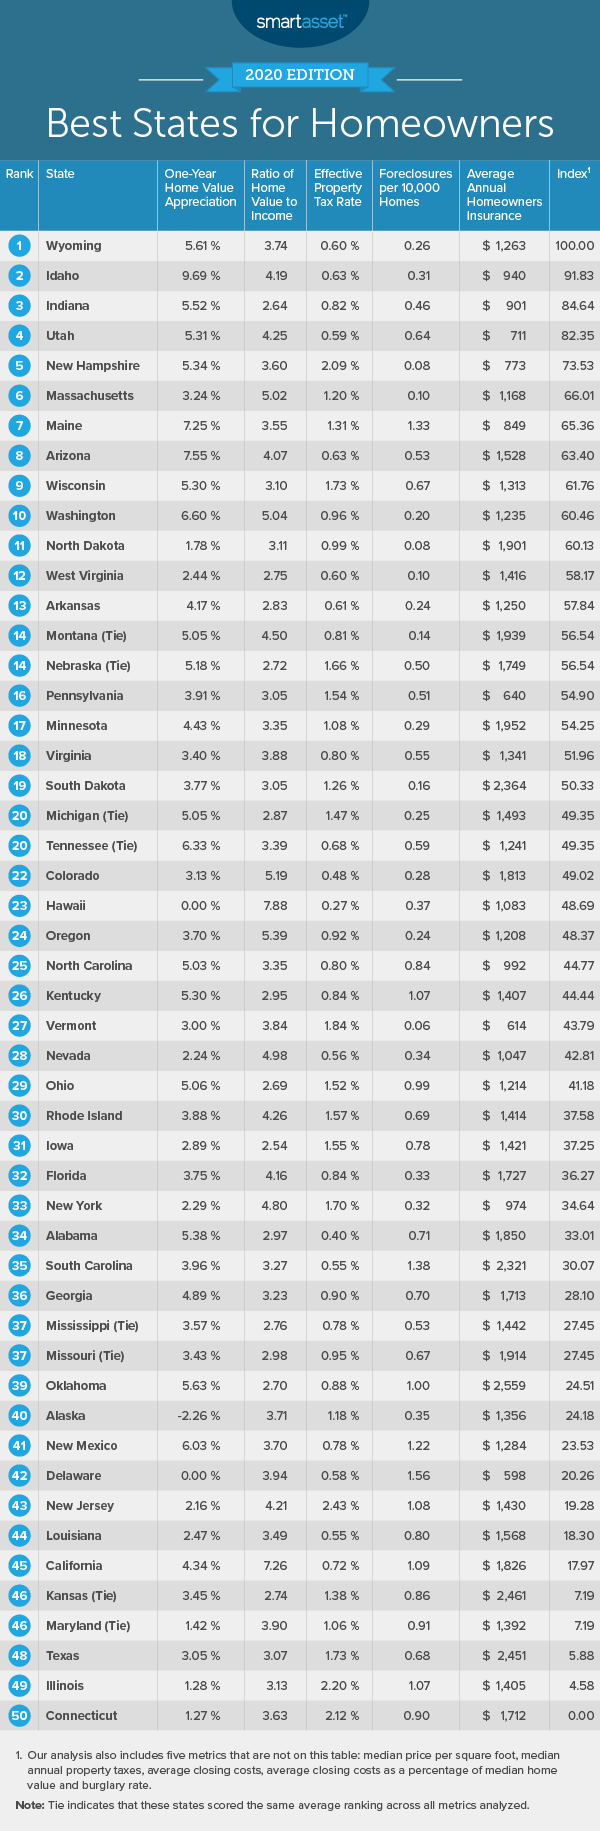
1. Wyoming
Wyoming ranks as the best state for homeowners in 2020, placing in the top 20 for eight of the 10 metrics we considered. It ranks particularly well for its low property taxes and recent home value appreciation. In 2018, the median annual property taxes paid by homeowners was $1,372 and the effective property tax rate was 0.60% – the 12th– and ninth-lowest values for these metrics, respectively. Moreover, homes in Wyoming have appreciated in value significantly over the past year. The median value per square foot rose by 5.61% from January 2019 to January 2020, the eighth-highest rate in the study. As a result, the median value per square foot in January 2020 was $433, sixth-highest in our study.
2. Idaho
The median value per square foot in Idaho rose by close to 10% in the year leading up to January 2020 – the best rate for this metric across all 50 states. Homeowners in Idaho also have relatively low property taxes. Our data shows that the median annual property taxes paid in the state are less than $1,500 (15th-lowest overall), and the 2018 effective property tax rate is 0.63% (13th-lowest).
3. Indiana
Homeownership in Indiana is relatively attainable for the average household. In 2018, the home value to income ratio was 2.64, the second-lowest in our study. Indiana additionally ranks well for its low property taxes, closing costs and homeowners insurance. The median annual figure paid in property taxes in Indiana is $1,214, the eighth-lowest across all 50 states. Meanwhile, average closing costs ($2,627) and average annual homeowners insurance ($901) are the second- and seventh-lowest, respectively.
4. Utah
Utah falls slightly in our rankings this year compared to last year’s edition but still places as the No. 4 state for homeowners this year. Utah ranks in the top 10 for four metrics. It has the fifth-highest median value per square foot ($555), the eighth-lowest effective property tax rate (0.59%), eighth-lowest closing costs as a percentage of home value (1.20%) and fourth-lowest average annual homeowners insurance ($711).
5. New Hampshire
Prospective homeowners should know that New Hampshire falls behind other states when it comes to property taxes. Census Bureau data from 2018 shows that it has the third-highest median annual property taxes paid by residents, at about $5,600. As a result, the effective property tax rate is 2.09%, the fourth-highest in our study.
Despite this, however, homeowners can enjoy the fact that the state ranks extremely well for its low number for foreclosures and low burglary rate. July 2020 data from realtytrac.com shows that there has been only one foreclosure per every 125,524 homes in the state, or a rate of 0.08 per 10,000 homes, the second-lowest rate for this metric in the study. Additionally, according to 2018 FBI crime data, New Hampshire has the lowest burglary rate – about 136 per 100,000 residents – of all 50 states.
6. Massachusetts
In this year’s study, Massachusetts ranks in the top 15 for five metrics. It has the seventh-highest median value per square foot ($414), fifth-lowest number of foreclosures per 10,000 homes (0.10), sixth-lowest average closing costs as a percentage of median home value (1.03%), 13th-lowest average annual homeowners insurance ($1,168) and fourth-lowest burglary rate (about 201 per 100,000 residents).
7. Maine
Maine ranks in the top 10 for three study metrics. It has the third-highest one-year home value appreciation (7.25%), sixth-lowest average annual homeowners insurance ($849) and fifth-lowest burglary rate (about 203 per 100,000 residents). Beyond this, Maine ranks in the top half of states for three other study factors: median value per square foot, average closing costs and average closing costs as a percentage of median home value.
8. Arizona
On half of the metrics in our study, Arizona ranks in the top 20. It has the eighth-highest median value per square foot ($413), the second-highest home value appreciation (7.55%) and 13th-lowest average closing costs as a percentage of median home value (1.35%). Additionally, property taxes in Arizona are favorable for homeowners. The state has the 16th-lowest median annual property taxes (at about $1,500) and 12th-lowest effective property tax rate (at 0.63%).
9. Wisconsin
Wisconsin ranks in the top 15 of the study for three of the 10 metrics we considered. It has the 13th-highest home value appreciation (5.30%), 14th-lowest average closing costs ($3,326) and 10th-lowest burglary rate (less than 243 per 100,000 residents). Homeownership may be more attainable for Wisconsin residents as well. In 2018, the ratio of the median home value to median household income was 3.10, the 17th-best in our study.
10. Washington
Washington State rounds out our list of the top 10 states for homeowners in 2020, ranking well for its one-year home value appreciation and low average closing cost as a percentage of median home value. Homes in Washington had the fourth-highest home value appreciation between January 2019 and January 2020, rising in value by close to 7%. Moreover, average closing costs as a percentage of median home value in the state are the fifth-lowest overall, at about 1%.
Data and Methodology
To find the best states for homeowners, we compared data for all 50 states across a total of 10 metrics. Six of those metrics were given a full weight, shown below:
- Median price per square foot. Data comes from Zillow and is for January 2020.
- Home value appreciation. The is the percentage change in the median price per square foot from January 2019 to January 2020. Data comes from Zillow.
- Ratio of home value to income. This is the median home value divided by the median household income. Data comes from the Census Bureau’s 2018 1-year American Community Survey.
- Foreclosures per 10,000 homes. Data comes from realtytrac.com and is for July 2020.
- Average annual homeowners insurance. Data comes from ValuePenguin and is for June 2020.
- Burglary rate. This is the number of burglaries per 100,000 residents. Data comes from the FBI and is for 2018.
We half-weighted the remaining four metrics:
- Median annual property taxes. Data comes from the Census Bureau’s 2018 1-year American Community Survey.
- Effective property tax rate. This is the median annual property taxes paid divided by the median home value. Data for both components comes from the Census Bureau’s 2018 1-year American Community Survey.
- Average closing costs. Data comes from SmartAsset’s closing costs calculator.
- Average closing costs as a percentage of median home value. This is average closing costs divided by the median home value. Data comes from SmartAsset’s closing costs calculator and the Census Bureau’s 2018 1-year American Community Survey.
We ranked each state in every metric, and using the weightings described above, we found each state’s average ranking. From there, we created our final score. The state with the best average ranking received a score of 100 while the state with the worst average ranking received a score of 0.
Home Buying Tips
- Make sure buying is the right decision. When you’re moving to a new city, you need to decide if you are going to rent or buy. If you are coming to a city and plan to stay for the long haul, buying may be the better option for you. On the other hand, if your stop in a new city will be a short one, you’ll likely want to rent. Our rent vs. buy calculator can help you map out the trade-offs between the two options.
- Calculate the full costs. Property taxes and homeowners insurance can add up. To better understand the full costs of homeownership, check out our comprehensive home buying guide. It has a property tax calculator, budget calculator and many informative articles that can help you make smart decisions regarding housing.
- Consider a financial advisor. Buying a home is a big decision and it may be a good idea to consult a financial advisor to better understand your financial situation and what kind of house you can afford. Finding the right financial advisor that fits your needs doesn’t have to be hard. SmartAsset’s free tool matches you with financial advisors in your area in 5 minutes. If you’re ready to be matched with local advisors that will help you achieve your financial goals, get started now.
Questions about our study? Contact us at press@smartasset.com
Photo credit: ©iStock.com/shapecharge