 Written by
Manufacturing has a special place in the American story, but for the past few decades, this sector has been largely on the decline, impacting many workers and affecting decisions around things like budgeting and where they call home. Since 1997, more than 91,000 manufacturing plants have closed and almost 5 million manufacturing jobs have been lost, according to a 2020 study from the Economic Policy Center. Still, there are jobs to be had and careers to be built in the world of manufacturing in the U.S., provided you are looking in the right places. To that end, SmartAsset analyzed various data to find the best places to work in manufacturing in 2020.
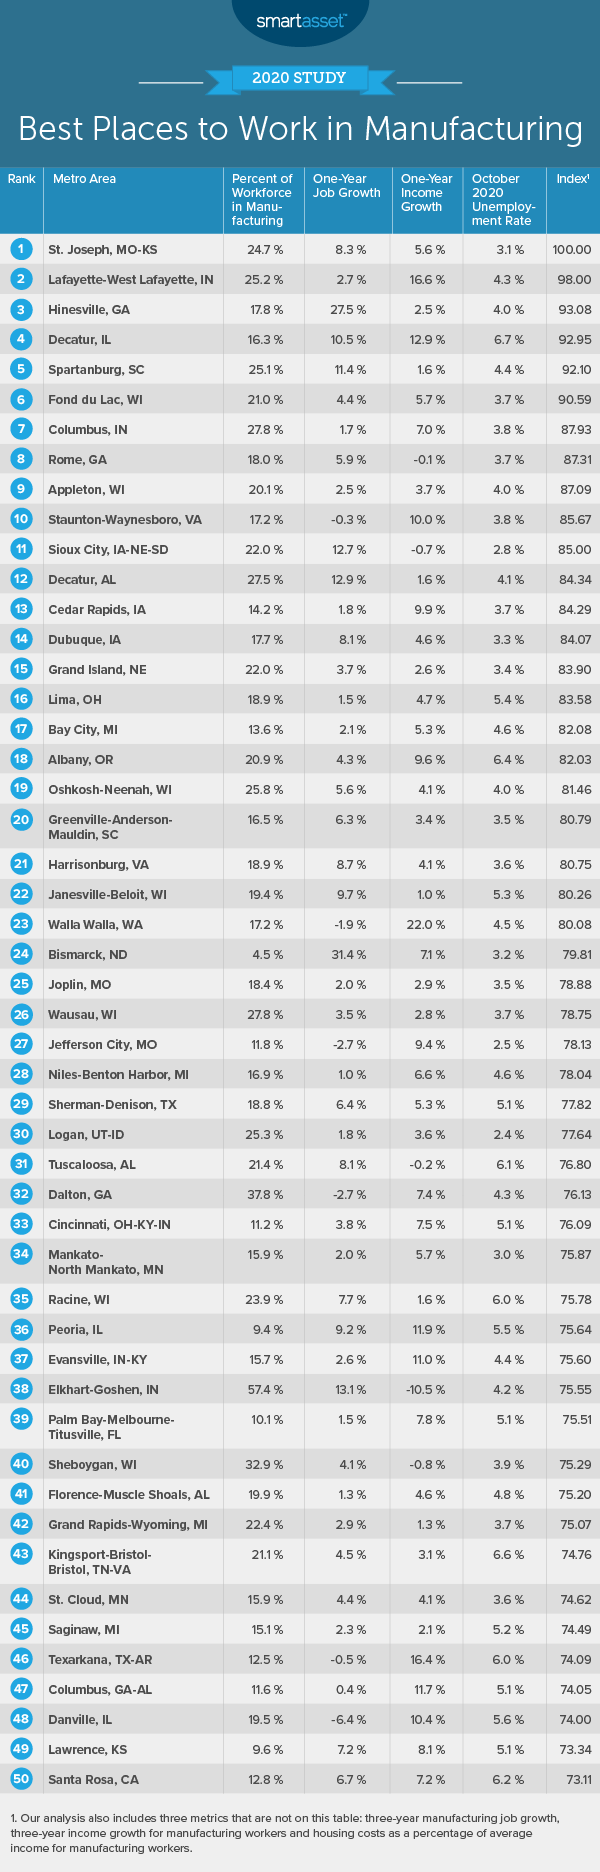
To find the best places to work in manufacturing, we compared 378 metro areas across the following metrics: manufacturing as a percentage of the workforce, job and income growth between 2015 and 2018, job and income growth between 2017 and 2018, housing costs as a percentage of income and unemployment. For details on our data sources and how we put all the information together to create our final rankings, check out the Data and Methodology section below.
This is SmartAsset’s fifth study on the best places to work in manufacturing. Read the 2019 version here.
Key Findings
- About one in 10 U.S. jobs is in manufacturing. Manufacturing represents 11.39% of jobs on average across all 378 metro areas we analyzed in our study. The metropolitan area where manufacturing makes up the highest percentage of jobs is Elkhart-Goshen, Indiana, where 57.45% of all jobs are in the manufacturing sector. The area where this rate is lowest is Laredo, Texas, where just 0.84% of the workforce is in manufacturing.
- In recent years, manufacturing income has grown faster than jobs in the industry. From 2015 to 2018, the average number of manufacturing jobs has grown by just 3.66%, while the average income for manufacturing workers has grown by 6.44%.
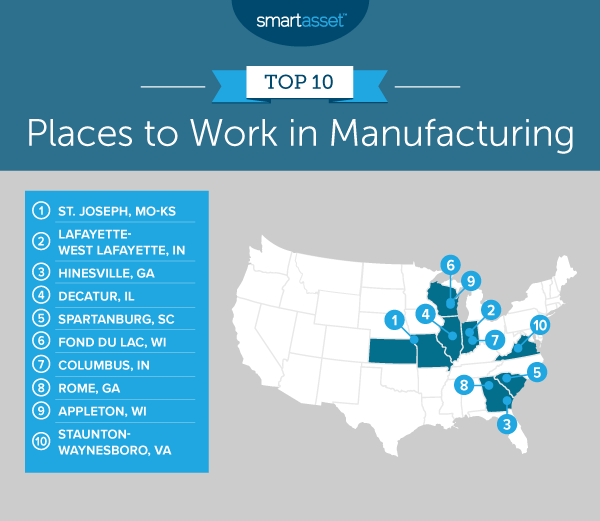
1. St. Joseph, MO-KS
The St. Joseph metropolitan area, located in both Missouri and Kansas, has 24.74% of its workforce in manufacturing, the 18th-highest rate in this study. It’s also a place where jobs are fairly easy to come by: The unemployment rate in October 2020 was just 3.1%, 16th-lowest across all 378 areas we studied. St. Joseph scores lower in terms of income growth between 2015 and 2018 – though still within the top half of the study – coming in 145th for this metric, at 7.61%.
2. Lafayette-West Lafayette, IN
In the Lafayette-West Lafayette, Indiana metro area, home to Purdue University, around 25.23% of the workforce consists of manufacturing workers, the 16th-highest rate for this metric in the study. Income growth between 2017 and 2018 was especially high here, at 16.64%, seventh-highest of the 378 metro areas we analyzed. This seems to be a recent development, though, as income growth between 2015 and 2018 was not as robust at 8.73%, ranking in the top third of the study at 126th.
3. Hinesville, GA
Hinesville, Georgia saw manufacturing job growth of 27.50% between 2017 and 2018, the third-highest increase for this metric in the study. It also finished 38th in terms of job growth between 2015 and 2018, at a total of 14.50%. In this metro area, 17.81% of the workforce is in manufacturing, placing this coastal community 59th in the study for this metric, a top quartile finish.
4. Decatur, IL
Decatur, Illinois, in the central part of the Land of Lincoln, saw income for manufacturing jobs increase by 33.08% between 2015 and 2018, the fourth-highest increase in the study for this metric. The one-year increase in manufacturing job income between 2017 and 2018 was 12.88%, the 10th-highest bump in the study. Decatur is also a fairly affordable place to live, as housing costs represent just 10.81% of income on average, the fifth-lowest rate for this metric across all 378 metro areas in the study.
5. Spartanburg, SC
In Spartanburg, South Carolina, manufacturing jobs represent 25.05% of the entire workforce, the 17th-highest percentage for this metric overall. Spartanburg also ranks in the top 20 for both job-growth metrics: It comes in 15th for job growth between 2017 and 2018 (11.45%) and 18th for job growth between 2015 and 2018 (18.98%).
6. Fond du Lac, WI
In Fond du Lac, Wisconsin, 20.98% of the workforce holds jobs in manufacturing, the 30th-highest percentage we saw in the study for this metric. The unemployment rate in Fond du Lac for October 2020 was 3.7%, the 32nd-lowest rate on this list. The Fond du Lac metro area ranks toward the middle of the study in terms of housing costs as a percentage of income, placing 155th at 19.29%.
7. Columbus, IN
Manufacturing employees constitute 27.78% of the workforce in the Columbus, Indiana metro area, the 10th-highest rate for this metric in the study. From 2017 to 2018, the manufacturing job base grew just 1.67%, ranking 177th of 378 overall. The metro area also ranks toward the middle of the study in terms of housing costs as a percentage of income, ranking 160th with housing costs at 19.37% of income on average.
8. Rome, GA
Between 2017 and 2018, income for manufacturing workers actually went down 0.09% in the Rome, Georgia metro area, placing the locale in the bottom quarter of the study for this metric. However, the job market there is fairly strong right now: The unemployment rate in October 2020 was just 3.7%, 32nd-lowest overall. The Rome metro area is also a fairly robust town for manufacturing job opportunities, with 17.98% of jobs being in manufacturing, the 57th-highest rate we analyzed for this metric and a top-quartile result.
9. Appleton, WI
The workforce in the Appleton, Wisconsin metro area is 20.08% manufacturing employees, the 37th-highest rate of the 378 areas we studied. It also ranks strongly for long-term income growth, with pay for manufacturing jobs increasing 16.33% between 2015 and 2018, the 34th-largest leap we analyzed. Appleton’s job growth over the same time period is strong but not quite as robust, placing 102nd overall, at 8.63%.
10. Staunton-Waynesboro, VA
The final entry on this list is the Staunton-Waynesboro, Virginia metropolitan area. The metro area saw manufacturing jobs decrease by 0.32% between 2017 and 2018, ranking 256th overall for this metric. However, it performs well in terms of income growth between 2017 and 2018, for which it places 23rd of 378, at 9.97%. The Staunton metro area also ranks well for job growth between 2015 and 2018, with a 15.26% jump that places it 34th in the study for this metric.
Data and Methodology
To find the best places to work in manufacturing, we compared 378 metropolitan areas across the following metrics:
- Manufacturing as a percentage of the workforce. This is the percentage of all workers employed by manufacturing firms. Data comes from the Census Bureau’s 2018 County Business Patterns Survey.
- Three-year job growth. This is the percentage change in the number of people employed by manufacturing firms from 2015 to 2018. Data comes from the Census Bureau’s 2015 County Business Patterns Survey and Census Bureau’s 2018 County Business Patterns Survey.
- One-year job growth. This is the percentage change in the number of people employed by manufacturing firms from 2017 to 2018. Data comes from the Census Bureau’s 2017 County Business Patterns Survey and Census Bureau’s 2018 County Business Patterns Survey.
- Three-year income growth. This is the percentage change in manufacturing workers’ average incomes from 2015 to 2018. Data comes from the Census Bureau’s 2015 County Business Patterns Survey and Census Bureau’s 2018 County Business Patterns Survey.
- One-year income growth. This is the percentage change in manufacturing workers’ average incomes from 2017 to 2018. Data comes from the Census Bureau’s 2017 County Business Patterns Survey and Census Bureau’s 2018 County Business Patterns Survey.
- Housing costs as a percentage of average income for manufacturing workers. Data on median housing costs comes from the Census Bureau’s 2019 1-year American Community Survey. Data on the average income for manufacturing workers comes from the Census Bureau’s 2017 County Business Patterns Survey.
- Unemployment rate. Numbers come from the Bureau of Labor Statistics and are for October 2020. This rate incorporates all professions, not just manufacturing-specific ones.
First, we ranked each metro area in each metric. From there, we found the average ranking for each metro area, giving an equal weight to all metrics except for manufacturing as a percentage of the workforce, which we double-weighted. We then ranked the areas based on this average ranking. The metro area with the best average ranking received an index score of 100 and the metro area with the worst average ranking received an index score of 0.
Tips for Manufacturing a Solid Financial Strategy
- Find an expert who will help you build a financial plan. Whether you work in manufacturing or some other industry, a financial advisor can help you make the most of your income and other money. Finding the right financial advisor doesn’t have to be hard. SmartAsset’s free tool matches you with financial advisors in your area in five minutes. If you’re ready to be matched with local advisors that will help you achieve your financial goals, get started now.
- To buy or to rent? If you’re moving to a new city to work in a manufacturing job, you’ll need to find a place to live. Use SmartAsset’s free calculator to see whether it makes sense to buy or rent.
- Work hard; save hard. Chances are, you don’t want to be in the workforce at your manufacturing job for your entire life; eventually, you’d like to retire. If your company offers a workplace retirement plan like a 401(k), make sure to take advantage of it, as it is the easiest option for saving for retirement.
Questions about our study? Contact press@smartasset.com.
Photo credit: ©iStock.com/shironosov