 Written by
Finding steady income in a reliable sector is an important consideration for where Americans decide to put down roots and take out a mortgage. The manufacturing industry, one such robust sector, accounts for 8% of the U.S. workforce. Those 12.8 million employees are scattered nationwide, the percentage of the local workforce consisting of manufacturing workers is higher in some places than in others. That’s why SmartAsset uncovered the best places to work in manufacturing in the U.S.
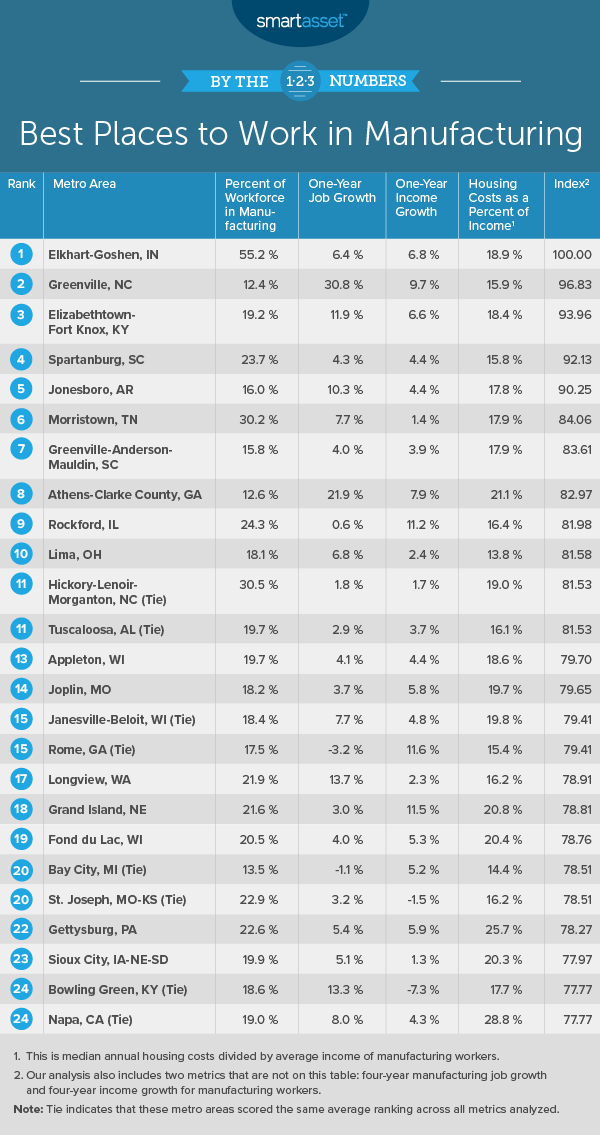
In this study, we examined the best places to work in manufacturing by considering the percentage of the workforce employed by the manufacturing industry, job and income growth and how average incomes compare to median annual housing costs in each metro area. For more information on our data sources and how we put all the information together to create our final rankings, check out the Data and Methodology section below.
This is SmartAsset’s fourth annual study on the best places to work in manufacturing. Read the 2018 version of the study here.
Key Findings
- The Midwest and South rank well. Of the top 10 places to work in manufacturing, three are in the Midwest, and the remaining seven are in the South. Moreover, there are 11 Midwestern states and 11 Southern states in the top 25. The metro areas in these regions excel at job growth and income growth for manufacturing workers.
- The fluctuation in manufacturing jobs varies greatly by place. On average, across the 376 areas in our study, manufacturing jobs have increased by more than 4% from 2014 through 2017. Yet, this growth is not evenly distributed. During this time period, 21 metro areas in our study saw the number of manufacturing jobs increase by more than 20%, while eight metro areas saw a decrease of over 20%.
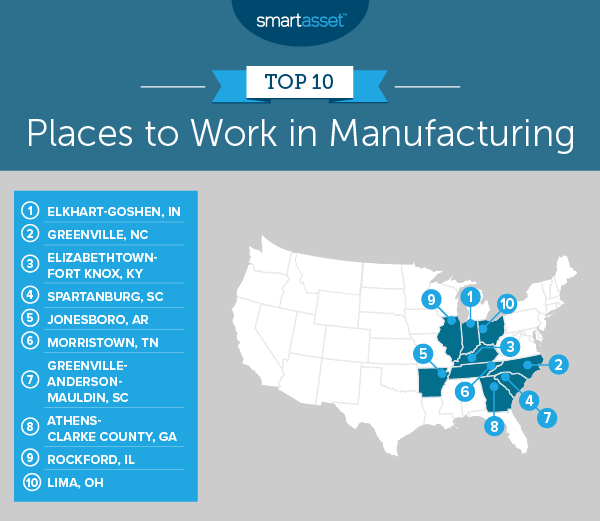
1. Elkhart-Goshen, IN
Manufacturing is the largest industry in Elkhart-Goshen, Indiana, employing 55.2% of the workforce, the highest percentage for this metric out of the 376 metro areas in our study. In 2017, there were almost 73,000 manufacturing workers, an increase of about 20.5% from 2014 – the 19th-highest increase in the study overall – and about 6.4% from 2016 – the 60th-highest increase in the study.
2. Greenville, NC
Though the manufacturing industry in Greenville, North Carolina is much smaller than in Elkhart-Goshen, it has grown substantially over the past several years. In 2014, there were a total of 5,319 manufacturing workers, and in 2017, there were 7,521, marking an increase of more than 40% over that four-year period. Additionally, from 2016 to 2017 alone, the number of manufacturing jobs in Greenville grew by 30.8% – the biggest increase for this metric across all 376 metro areas in our study.
3. Elizabethtown-Fort Knox, KY
Elizabethtown-Fort Knox, Kentucky has seen relatively substantial growth in the number of manufacturing jobs in recent years. According to Census Data, the number of manufacturing jobs in the Elizabethtown metro area increased from 2014 through 2017 by 27.3%, the ninth-highest increase of any area in the study. Furthermore, from 2016 to 2017, there was an increase of 11.9%, the 16th-highest increase overall. Average incomes for manufacturing workers also grew by 6.6%, from just over $50,000 in 2016 to almost $53,500 in 2017.
4. Spartanburg, SC
Spartanburg, South Carolina ranks in the top third of metro areas for all six metrics we considered. Specifically, 2017 data from the County Business Patterns Survey shows that a whopping 23.7% of the workforce was employed by the manufacturing industry, the 17th-highest percentage of any metro area in our study. Additionally, we estimated that annual housing costs in the metro area are only 15.8% of average incomes for manufacturing workers, the 44th-best rate for affordability across all 376 metro areas in our study.
5. Jonesboro, AR
Job and income growth for manufacturing workers in Jonesboro, Arkansas has been strong in recent years. Between 2016 and 2017, the number of manufacturing jobs grew by 10.3%, and average incomes for manufacturing workers increased by 4.4%. Over the four years leading up to 2017, manufacturing jobs grew by 17.4%, and average incomes increased by 9.0%. Those employed in the manufacturing industry who have kids are in luck: Jonesboro ranks as one of the top places for working parents.
6. Morristown, TN
From 2014 to 2017, the number of manufacturing jobs in Morristown, Tennessee increased by 12.7%, the 56th-highest rate for this metric across all 376 metro areas in our study. That growth contributes to the fact that Morristown has the second-largest percentage of its workforce employed by the manufacturing industry of any area in our top 10, following only our No. 1 metro area, Elkhart-Goshen. In 2017, more than 12,000 residents in the Morristown metro area worked in manufacturing, which equals almost a third of its total workforce.
7. Greenville-Anderson-Mauldin, SC
Greenville-Anderson-Mauldin, South Carolina ranks in the top third of all 376 metro areas in our study for all six metrics. It has the 89th-highest percentage of its workforce employed by the manufacturing industry and ranks 103rd– and 100th– best out of 376 for its large one-year and four-year increases in number of manufacturing jobs. It also ranks within the top 10% of the study for four-year income growth from 2014 through 2017, at 13.4%.
8. Athens-Clarke County, GA
Athens-Clarke County, Georgia stands out as one of the best places to work in manufacturing because of its strong job growth in recent years. From 2014 to 2017, the number of manufacturing jobs increased by 32.5%, the seventh-highest increase of any area in the study. Moreover, from just 2016 to 2017, the number of manufacturing jobs increased by 22.0%, the sixth-highest rate across all 376 metro areas in our study.
9. Rockford, IL
The number of manufacturing jobs in Rockford, Illinois has remained relatively flat over the past several years. Though they had a slight increase of 0.6% from 2016 to 2017, over a longer time period of 2014 through 2017, the number of manufacturing jobs decreased by 0.5%. Despite this, Rockford performs in the top 20% of the study for the four other metrics we considered, which contributes to its No. 9 spot overall. About 24.3% of the workforce worked in manufacturing in 2017, and average incomes increased by 11.2% from 2016 to 2017, the highest increase of any metro in our top 10 and 19th-highest overall.
10. Lima, OH
Though average incomes for manufacturing workers have remained relatively flat in Lima, Ohio over the past several years, they are high relative to the other metro areas we considered in this study. In 2017, the average income for a worker in manufacturing in Lima was almost $64,000. Due to high income and lower housing costs, housing costs as a percentage of average income for manufacturing workers is the lowest of any metro in our top 10 and 22nd-lowest overall. We estimate that annual housing costs make up only 13.8% of the average income for a manufacturing worker in Lima.
Data and Methodology
In last year’s study on the best places to work in manufacturing, we looked at 480 metro and micro areas. This year, we considered only metro areas, looking at 376 of them for which complete data was available. We considered the following six factors:
- Manufacturing as a percentage of the workforce. This is the percentage of all workers employed by manufacturing firms. Data comes from the Census Bureau’s 2017 County Business Patterns Survey.
- Four-year job growth. This is the percentage change in the number of people employed by manufacturing firms from 2014 through 2017. Data comes from the Census Bureau’s 2014 County Business Patterns Survey and Census Bureau’s 2017 County Business Patterns Survey.
- One-year job growth. This is the percentage change in the number of people employed by manufacturing firms from 2016 to 2017. Data comes from the Census Bureau’s 2016 County Business Patterns Survey and Census Bureau’s 2017 County Business Patterns Survey.
- Four-year income growth. This is the percentage change in manufacturing workers’ average incomes from 2014 through 2017. Data comes from the Census Bureau’s 2014 County Business Patterns Survey and Census Bureau’s 2017 County Business Patterns Survey.
- One-year income growth. This is the percentage change in manufacturing workers’ average incomes from 2016 to 2017. Data comes from the Census Bureau’s 2016 County Business Patterns Survey and Census Bureau’s 2017 County Business Patterns Survey.
- Housing costs as a percentage of average income for manufacturing workers. Data on median housing costs comes from the Census Bureau’s 2018 1-year American Community Survey. Data on the average income for manufacturing workers comes from the Census Bureau’s 2017 County Business Patterns Survey.
First, we ranked each metro area in every metric, giving all metrics an equal weighting except manufacturing as a percentage of the workforce, which was double weighted. We then found each area’s average ranking and used the average to determine a final score. The metro area with the highest average ranking received a score of 100. The metro area with the lowest average ranking received a score of 0.
Tips for Manufacturing a Robust Savings
- Invest early. You may be a whiz at the factory or mill, but achieving financial security requires a more nuanced, proactive approach. By planning and saving early you can take advantage of compound interest. Take a look at our investment calculator to see how your investment can grow over time.
- Consider a place’s cost of living when you get a mortgage and compare rates. Many of the top places to work in manufacturing have relatively low costs of living. Check out our cost of living calculator to see how the cost of living in your current location compares to some of the places that rank well on our list. A low cost of living means that less of your income may go toward unavoidable expenses such as housing and food. Also, make sure you compare mortgage rates.
- Get trusted personal finance advice. You may be an expert when it comes to nonmetallic minerals or plastics, but as far as your finances are concerned, it’s best to leave it to the pros. A financial advisor can help you make smarter financial decisions such as moving or being in better control of your money as you navigate finding a new job. Finding the right financial advisor that fits your needs doesn’t have to be hard. SmartAsset’s free tool matches you with financial advisors in your area in five minutes. If you’re ready to be matched with local advisors that will help you achieve your financial goals, get started now.
Questions about our study? Contact us at press@smartasset.com
Photo credit: ©iStock.com/Drazen Zigic