 Written by
Ever wondered how trick-or-treating conditions in your neighborhood stack up against those in other cities? Should your neighbors give out more candy to your kids? Is your area as safe on Halloween night as it is across town? It’s hard to know for sure. That’s why we created a list of the best places to trick-or-treat. We ranked 252 of the largest U.S. cities using seven metrics, including local crime rates, weather and home affordability. Read on to learn what we discovered.
This is the third annual study of the best places to trick-or-treat. Read the 2015 study here.
Study Specifics
Our analysis is based on several assumptions. We assumed that living in an area with a large population of children would be most beneficial to trick-or-treaters (since residents should be more inclined to hand out candy). So we looked at the percentage of kids under age 15 in each city and the number of single-family homes per square mile (more homes means there’s a greater chance to grab more treats).
We also assumed that 60 degrees Fahrenheit was the ideal temperature for trick-or-treating. So we pulled the average maximum temperature for each city on Halloween and compared it to the “perfect” temperature. You can read more about our methodology below.
Buying a house? Find out how much you can afford to pay.
Key Findings
- Western and Midwestern cities rank well. Most of the cities that appear on the top of our list are located in these two regions. Low median home values and low crime rates make these cities attractive places to live. Both of these areas were the best places for trick-or-treaters in 2015 too.
- Florida flops. West Palm Beach, Miami and Tallahassee are some of the worst places to trick-or-treat. Halloween just isn’t the same when the high for the day is above 80 degrees.
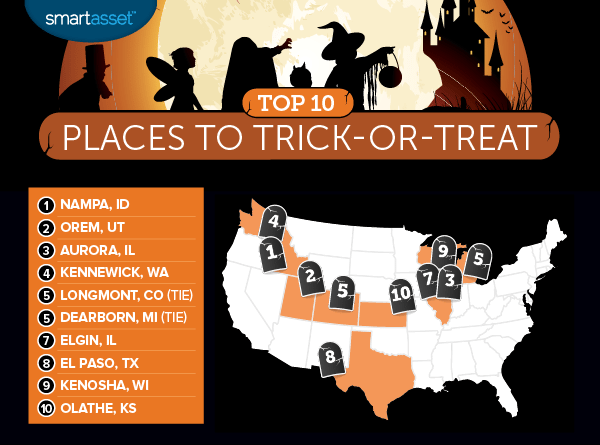
1. Nampa, Idaho
Nampa ranks as the best city for trick-or-treating for the second consecutive year. That means it’s still the No. 1 place for kids eager to stock up on chocolate, snacks and lollipops on October 31. If you want to get into the Halloween spirit, you and your children can stop by a local pumpkin patch like the one at the Berry Ranch or Wissell Farms.
2. Orem, Utah
Orem ranks as the second best place for trick-or-treating, up from the third spot in last year’s analysis. The city is located about 40 miles from Salt Lake City and has around 94,457 residents.
Weather can potentially make or break a Halloween party. And cold temperatures may prevent kids from visiting all the homes in their neighborhoods. Fortunately, the average high temperature in Orem on October 31 is just 0.5 degrees away 60 degrees, which we believe is the ideal Halloween temperature.
3. Aurora, Illinois
If you’re trick-or-treating in Aurora, you’ll probably need a jacket. On average, the high on October 31 is just 56 degrees.
Residents in Aurora seem to take Halloween pretty seriously. Seasonal festivities begin weeks before October 31. Families can attend all sorts of events like the annual Pumpkin Weekends held at Blackberry Farm. During weekends throughout the month of October, kids can make crafts, listen to pumpkin stories and ride on a hay wagon.
4. Kennewick, Washington
Kids under age 15 account for less than a quarter of the total population in Kennewick, Washington. But Halloween is still a big deal in the area. The Halloween Trick-or-Treat Bash takes place on October 31. So if your neighbors don’t hand out many treats over the weekend, you can make up for it by attending the annual event downtown.
5. (tie) Longmont, Colorado
Your chances of having to trick-or-treat in the rain are much lower in Longmont than they are in other Colorado cities like Aurora and Denver. Longmont only has a 1.3% chance of getting a significant amount of rain or snow on Halloween. In contrast, Aurora has dealt with precipitation 12.3% of the time on October 31.
Longmont typically has a near-perfect temperature on Halloween, too. The average high is 60.6 degrees.
Related Article: 19 Things You Need to Know About Moving to Denver
5. (tie) Dearborn, Michigan
Dearborn has moved up on our list of the best places to trick-or-treat. The city ranked eighth in our 2015 analysis. Since last year, property crime rates in the city have fallen. Meanwhile, the median home value has risen by about 26.4%.
Children who celebrate Halloween can participate in a wide range of activities in Dearborn. One example is the annual kids’ Halloween party at the Dearborn Historical Museum.
7. Elgin, Illinois
Elgin is located in northern Illinois. The city is about 35 miles away from Chicago and is home to roughly 111,076 people. Our analysis reveals that Elgin has a relatively low violent crime rate. We also found that there are about 662 single-family homes per square mile. Since more homes means more candy, satisfying your sweet tooth shouldn’t be too difficult.
8. El Paso, Texas
Halloween in El Paso is anything but chilly. The average maximum temperature on October 31 is 69.5 degrees. That’s something to consider before you pick out your kids’ costumes.
Even if you can’t stand the heat, hitting up as many homes as possible might be worth it. At the very least, your children can look forward to eating all the treats your neighbors pass out.
9. Kenosha, Wisconsin
The median home value in Kenosha, Wisconsin is just $141,100. Besides being an affordable place for homebuyers, the city has a high single-family home density. There are about 881 single-family homes per square mile, meaning that there are probably plenty of doorbells to ring and candy to collect.
10. Olathe, Kansas
Olathe is a safe place to live and trick-or-treat. Out of all the cities in our study, it has the third lowest violent crime rate with only 76 violent crimes per 100,000 residents.
Residents in Olathe live in one of the most populated cities in Kansas. If you don’t have any plans for Halloween, consider checking out the Olathe Fall Fest or the Trick-or-Treat Off the Street event at the Mahaffie Stagecoach Stop and Farm Historic Site. Your kids can wear their costumes to both events.
Methodology
To find the best places to trick-or-treat, we considered the following seven factors:
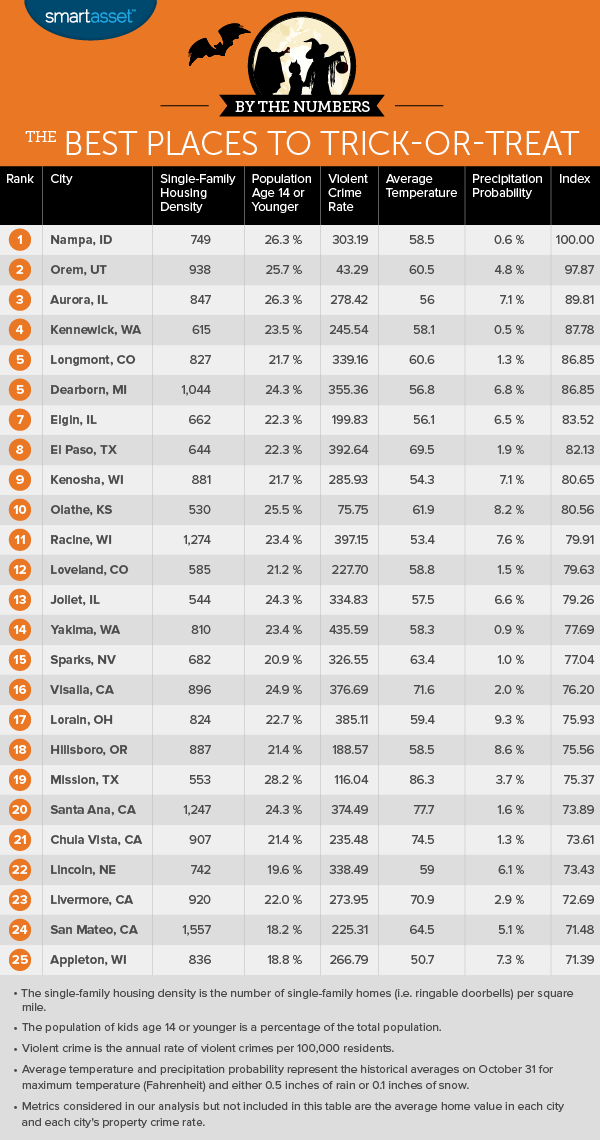
- Single-family housing density. This is the number of single-family homes per square mile. While there are kids who go trick-or-treating in their apartment buildings, we figured that the best Halloween experience would involve kids going from home to home.
- Population age 14 or younger. We looked at the number of children under age 15 as a percentage of the total population.
- Violent crime rate. This is the number of violent crimes per 100,000 residents.
- Property crime rate. This is the number of property crimes per 100,000 people.
- Median home value. We concluded that cities with inexpensive homes would be the best places for families (and trick-or-treaters) to live.
- Average temperature. This is the average maximum temperature in each city on October 31. We compared each city’s average temperature to the ideal temperature, or 60 degrees Fahrenheit.
- Precipitation probability. This reflects the historical odds of a city receiving either 0.1 inches of snow or 0.5 inches of rain on Halloween.
We completed our analysis by ranking all 252 cities, giving full weight to each of our metrics. Then we averaged those rankings and gave each city a score between 0 and 100. The highest ranking city scored a 100 while the lowest ranking city received a 0.
Data Sources
Violent and property crime rates are based on 2014 data from local police department websites and the FBI’s Uniform Crime Reporting Database. Weather data comes from the National Oceanic and Atmospheric Administration.
The 2015 edition of this study used three-year data from the U.S. Census Bureau’s American Community Survey. The Census no longer collects that data.
This year, average home values and data on the percentage of children in each city come from the U.S. Census Bureau’s 2015 one-year American Community Survey (ACS). Our density metric is based on five-year estimates from the 2012 edition of the American Community Survey and the 2010 Census Summary File. Our single-family housing unit data comes from the one-year 2015 American Community Survey.
The data analysis for this study was completed by Nick Wallace.
Questions about our study? Contact us at press@smartasset.com.
Photo credit: ©iStock.com/monkeybusinessimages