 Written by
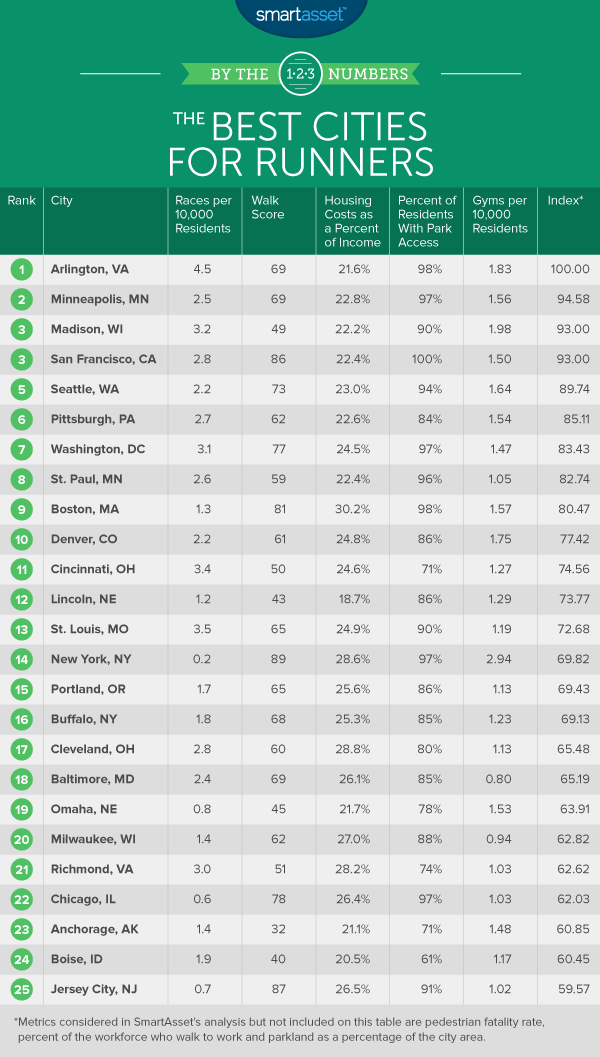
Nearly 17 million people competed in 30,400 U.S. road races in 2016, according to data from Running USA. But for Americans who are truly passionate about getting their daily steps in, not all cities are equal. Some cities are better for runners who prefer to run outdoors. While others are better for those who value access to competitive races. Below we look at these and other factors to rank the best cities for runners.
We looked at data for 100 U.S. cities across eight factors. Specifically we looked at data on the number of races per 10,000 residents, walkability, safety, housing cost as a percent of income, gyms per 10,000 residents, percent of a city covered by parkland and percent of residents with access to a park. Check out our data and methodology below to see where we got our data and how we put it together.
This is SmartAsset’s second annual study on the best cities for runners. Read the 2017 study here.
Key Findings
- Southwest USA is car territory – Cities in Southwestern states like Arizona and Nevada ranked at the bottom of this study. In total cities in those two states occupy five of the bottom 10 cities for runners. Those cities tend to have little parkland and are not very walkable.
- Tradeoff between walkability and housing costs – In general the most walkable cities tend to be the more expensive ones. Cities like Boston, San Francisco and Washington D.C. are all in the top 10 most walkable cities but also come with high housing costs.

1. Arlington, VA
Arlington, Virginia ranks first. Anyone who lives and runs in Arlington is probably aware of the large number of races in the city. According to our data, no city in the study has more races relative to population size than Arlington.
And if road races are not your speed, there are plenty of other ways to run in this city. It has top 10 scores for number of gyms per 10,000 residents and percent of residents who have park access.
2. Minneapolis, MN
Minneapolis has top 15 scores in six out of the eight metrics, so no matter what kind of running you prefer the city should have something for you. The city’s best scores come in pedestrian fatality rate and percent of residents with access to parks. It ranked second and fourth in those metrics, respectively.
Of course, winters in Minneapolis can be brutal, so outdoor running may be difficult for much of the year. Fortunately, the city also has a top 10 score in the number of gyms per 10,000 residents, meaning those who want to stay in shape on a treadmill during the cold months can do so.
3. (tie) Madison, WI
After Minneapolis comes another Midwest city, Madison, Wisconsin. In Madison, almost 9% of the workforce walks to work. That suggests this is a good city for those who prefer to get around using their two feet. It also leaves open the opportunity to jog to work.
According to our data, Madison also has the second-highest number of gyms per 10,000 residents in the study.
3.(tie) San Francisco, CA
According to our data, San Francisco is the third-most walkable city in the study. Many workers take advantage of this and choose to walk to work. In total around 11% of San Francisco workers get to work on foot.
Another bonus for runners in San Francisco is access to nature. According to our data, residents in no other city have as much access to parkland. That means most runners should be able to skip the crowded sidewalks and run in parks. And if all those SF hills don’t provide enough of a challenge, San Francisco has the 11th-most races per 10,000 residents in the study.
5. Seattle, WA
Seattle, Washington is another very walkable (or run-able!) city with plenty of amenities for runners. Most residents here have access to parks which can be great places to run. But if you are a runner who does not like running outside, Seattle has the sixth-most gyms per 10,000 residents.
You can also scratch your competitive itch in Seattle. We estimate that the city has the 19th-most races relative to its population. The most popular is probably the Seattle Marathon, which has been ranked as a top 20 U.S. marathon by Runner’s World magazine.
6. Pittsburgh, PA
In Pittsburgh, our data shows that a large proportion of residents choose to get to work by walking. In total, we estimate that 10% of the workforce walks to work. The city also has you covered if you are a runner who prefers indoor cardio. Pittsburgh has around 1.54 gyms per 10,000 residents, the 11th-most in our study.
The only thing missing from Pittsburgh’s running portfolio is a lack of parkland. Just 10% of the Steel City is covered by park, the second-lowest score in the top 10.
7. Washington, D.C.
The nation’s capital is great for runners who want plenty of access to races, parks and a walkable city. According to our data, Washington, D.C. has the ninth-highest walk score and eighth-most races per 10,000 residents. Twenty-two percent of the city is covered by park and 96% of residents live within a 10-minute walk of a park.
But this city is expensive and doesn’t score the highest in pedestrian safety. Washington, D.C. ranks 58th for housing costs as a percent of income and 67th for pedestrian fatality rate.
8. St. Paul, MN
The eastern half of the Twin Cities takes eighth. This city isn’t as walkable as some other cities in our top 10 which hurts its overall score. However, the vast majority of St. Paul residents have access to a park.
St. Paul also has the 13th-most races per 10,000 residents in our study which is good news for runners who like to push themselves.
9. Boston, MA
Boston’s running profile looks a lot like Washington, D.C.’s. Boston is one of the most walkable cities with plenty of parkland. Of course, Boston also hosts one of the most famous marathons in the country, the Boston Marathon.
10. Denver, CO
Denver occupies the final spot in our top 10. This city is probably best for people who prefer getting their runner’s high at the gym. We estimate Denver has the fifth-most gyms per 10,000 residents. The city also ranks in the top 25 for walk score, percent of residents who walk to work and races per 10,000 residents.
Data and Methodology
In order to rank the best cities for runners, we looked at data for 100 cities. Specifically we looked at data for the following eight metrics:
- Walk score. This is a measure of a city’s overall walkability. Data comes from Walkscore.com.
- Percent of workforce who walks to work. Data comes from the Census Bureau’s 2016 1-Year American Community Survey.
- Pedestrian fatality rate. This is the number of pedestrians killed in automobile accidents per 100,000 residents. Data comes from the National Highway Traffic Safety Administration, is for 2015 and is measured at the state level.
- Gyms per 10,000 residents. This is the number of gyms per 10,000 residents. Data comes from the Census Bureau’s 2015 County Business Survey.
- Races per 10,000 residents. Races includes all 5ks, 10ks, half-marathons, marathons and ultra-marathons which take place in the city. Data on races comes from runningintheusa.com and population data comes from the Census Bureau’s 2016 1-year American Community Survey.
- Percent of city which is parkland. This is the total adjusted city area divided by total parkland measured in acres. Data comes from the Trust for Public Land.
- Percent of residents who live within a 10-minute walk of a park. Data comes from the Trust for Public Land.
- Housing cost as a percent of income. This is annual median housing costs divided by median household income. It was included as a measure of affordability. Data comes from the Census Bureau’s 2016 1-Year American Community Survey.
We ranked each city in each metric, giving equal weighting to each metric. Then we found each city’s average ranking. Using this average ranking we created our final score. The city with the best average ranking received a 100. The city with the worst average ranking received a 0.
Tips for Getting the Best Mortgage Rates
- Pay a larger down payment. Depending on the type of home loan you’re planning to get, lenders may accept far less than the standard 20% down payment. However if you put less than 20% down, you’ll likely have to pay private mortgage insurance which isn’t ideal. If you have afford to put 20% down, you’ll likely qualify for a better rate.
- Get your credit in order. There are a slew of factors which lenders will use to determine your mortgage rate but one of the most important is your credit score. If your credit score is poor you may want to improve it before to take out a mortgage. The difference between a mortgage rate of 5% and 4% can mean tens of thousands of dollars.
- Figure out how long you want to be paying off your mortgage. Typically, most homebuyers take out either a 15-year mortgage or a 30-year mortgage. The benefit of the 15-year mortgage is that you will own your house faster and you will pay less interest over the course of your loan. On the other hand, a 30-year mortgage means you will be paying less per month on your mortgage.
Questions about our study? Contact us at press@smartasset.com.
Photo credit: ©iStock.com/pixelfit