 Written by
Television ratings reveal that hockey is far from being America’s favorite pastime. In fact, the numbers seem to suggest that the sport’s popularity is declining, especially in terms of viewership. Only 3.9 million viewers tuned in for the six-game Stanley Cup Finals in 2016, compared to the 5.6 million viewers who watched the series the previous year.
This is the third annual version of our study on the best hockey towns. Read the 2016 study here.
Despite what the ratings say, there are still plenty of Americans who love hockey. For those who live and breathe the sport, we ranked the best hockey towns in the nation.
Study Specifics
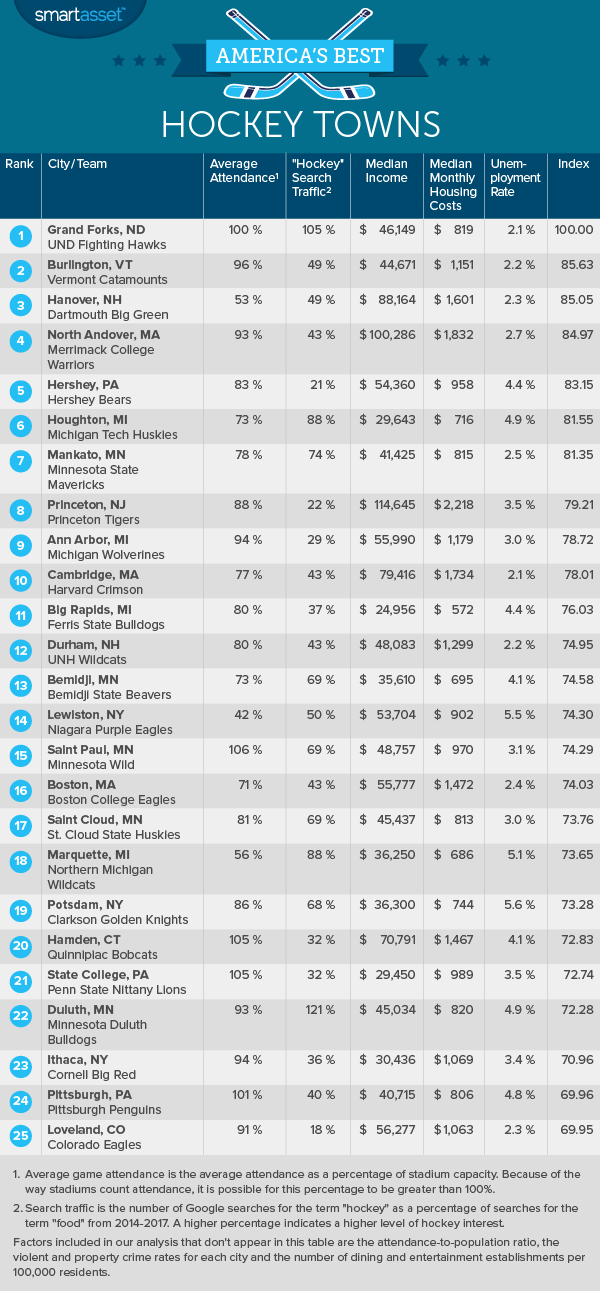
Our annual study of the country’s best hockey towns ranks 118 cities and towns with NHL, AHL, ECHL or NCAA Division I men’s hockey teams. We compared each of these places based on their fan intensity and quality of life. Specifically, we focused on metrics like the average game attendance as a percentage of stadium capacity and per-game attendance as a percentage of the total population in each hockey town.
We also considered local crime rates, unemployment rates, median household income, median monthly housing costs and Google search traffic for the term “hockey.” To learn more about how we conducted our study, read the methodology and data sections below.
Key Findings
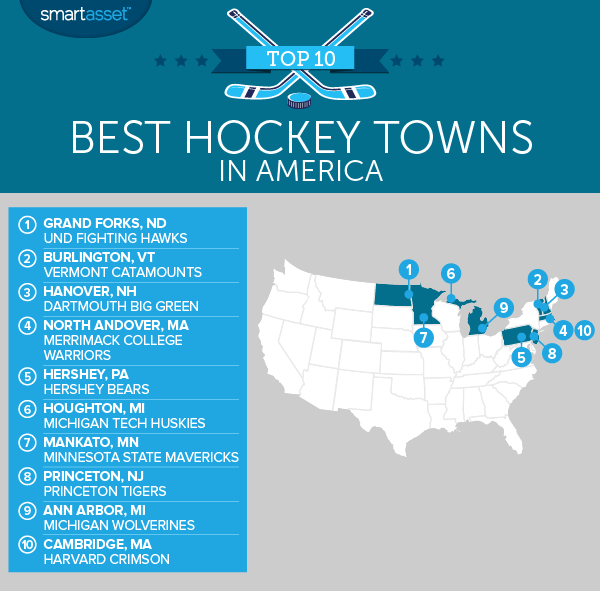
- College hockey towns top the list. Much like we found in the 2016 edition of our study, most of the best hockey towns in the country don’t have professional hockey teams.
- Grand Forks reigns supreme. For the third year in a row, this North Dakota city ranks as the No.1 best hockey town in America, based on our analysis.
- Three for three. Besides Grand Forks, three other hockey towns have made it into the top 10 for three consecutive years: Hanover, New Hampshire; Hershey, Pennsylvania and Houghton, Michigan.
1. Grand Forks, North Dakota (NCAA – North Dakota Fighting Hawks)
There’s nothing like being a hockey fan in Grand Forks, North Dakota. The average Fighting Hawks home game draws over 11,000 fans, filling its stadium to 100% capacity. Last spring, the men’s team won its eighth national championship in a game against the Quinnipiac Bobcats. No wonder Grand Forks consistently ranks as a top hockey town.
2. Burlington, Vermont (NCAA – Vermont Catamounts)
Burlington ranks as the second-best hockey town in America, up from the fourth spot in last year’s study. Thousands of fans fill the stands every home game to watch the University of Vermont Catamounts’ men’s hockey team take on the competition.
Besides being a great place to enjoy a hockey game, Burlington ranks well in terms of its quality of life. At 2.2%, its unemployment rate is among the lowest in our analysis. And if you’re looking for something to do after a game, there are plenty of bars and restaurants to choose from. Census data says that for every 100,000 residents, there are more than 228 dining and entertainment establishments.
3. Hanover, New Hampshire (NCAA – Dartmouth Big Green)
Hanover is another hockey town that offers its residents a high standard of living. Its unemployment rate is just 2.3% and Hanover is one of the wealthiest towns in the nation. The median household income is $88,164, meaning that a typical resident spends only about 22% of their income on housing costs like property taxes and insurance.
Average attendance at the Big Green’s men’s hockey games is equal to more than a quarter of Hanover’s total population. While the team only won about half of its games last season, the average game fills more than half of its stadium with fans.
4. North Andover, Massachusetts (NCAA – Merrimack College Warriors)
North Andover is a small town in North Eastern Massachusetts with a population of 29,271. It’s home to the Merrimack College Warriors, a Division I men’s hockey team. Even though the team had a rough season last year, the average game has filled the stadium to 93% capacity so far in the 2016-2017 season.
5. Hershey, Pennsylvania (AHL – Hershey Bears)
Attendance at Hershey Bears’ men’s hockey games averages 60% of Hershey’s entire population. That means it has the second-highest per capita attendance rate in our analysis. More than 8,700 fans attend each home game, on average, filling the Bears’ stadium to 83% capacity.
To say that Hershey Bears fans are loyal is an understatement. But that level of support is well-deserved. The Bears have won more championships than any other team in the AHL. While they didn’t win the Calder Cup last year, they finished out the season by making it into the finals.
6. Houghton, Michigan (NCAA – Michigan Tech Huskies)
Hockey is a big deal in Houghton, Michigan. Each home game for the Michigan Tech Huskies draws more than 3,200 fans, on average. And attendance at their games averages over 40% of Houghton’s total population. Within the past three years, Google search traffic for the term “hockey” in the city has been 88% higher than search traffic for the term “food.”
Related Article: The NBA Teams With the Most Die-Hard Fans
7. Mankato, Minnesota (NCAA – Minnesota State Mavericks)
For the second consecutive year, Mankato ranks as a top hockey town. Last year, it took the sixth spot on our list. Since we released the 2016 edition of our study, average attendance (as a percentage of stadium capacity) at the Mavericks’ men’s hockey games has fallen by 3.7%. Nevertheless, the team fills its stadium to 78% capacity, on average, each game. As of this writing, the Mavericks have won about 60% of their games this season.
8. Princeton, New Jersey (NCAA – Princeton Tigers)
Thanks to the high quality of life that it offers, Princeton ranks as the eighth-best hockey town in America. It’s one of the safest places in our study and has an unemployment rate of only 3.5%. It also has some of the richest residents in the nation. The median household income in Princeton is $114,645.
The Princeton Tigers men’s hockey team only won about 20% of its games during the 2015-2016 season. But that hasn’t deterred the team’s fans. So far this season, the Tigers have averaged nearly 2,000 fans per home game, filling their stadium to 88% capacity.
9. Ann Arbor, Michigan (NCAA – Michigan Wolverines)
The Michigan Wolverines’ men’s hockey team is known for drawing huge crowds to its games. It averages attendance of 94% capacity every home game, even though attendance equals only 5% of the city’s total population (on average). While the Wolverines haven’t won an NCAA championship since the late ’90s, they were the Big Ten Tournament champions in 2016. In addition to being one of the country’s best hockey towns, Ann Arbor recently ranked as one of the least-stressed cities in America.
10. Cambridge, Massachusetts (NCAA – Harvard Crimson)
When the Harvard Crimson take the ice, there are usually more than 2,300 fans in attendance. Based on the total population in Cambridge, that means the Harvard men’s hockey team only has a 2% per capita attendance rate. That may soon change in the future, however. As of this writing, the Harvard Crimson rank fourth among men’s hockey teams across the country.
Methodology
To find the best hockey towns in 2017, SmartAsset pulled data for 118 cities and towns with a team in one of the following four hockey leagues: the NCAA Division I men’s hockey league, the National Hockey League, the East Coast Hockey League or the American Hockey League. Then we ranked all of the places in our study across the nine metrics that we used in the 2016 edition of our study. As described below, these factors fall into two different categories that we used to create two separate scores: a fan intensity score and a quality of life score.
Fan Intensity Score
- Google search traffic for the term “hockey” as a percentage of traffic for the term “food.” This metric captures the general interest in hockey within a region between 2014 and 2017.
- Average game attendance as a percentage of stadium capacity.
- Per-game attendance among local hockey teams as a percentage of the total population. For example, Grand Forks, North Dakota has a population of nearly 55,000 and average per-game attendance of over 11,000. So their per capita attendance rate is roughly 20%.
Quality of Life Score
- Median monthly housing costs. This metric includes costs such as insurance, mortgage payments and taxes.
- Median household income.
- Unemployment rate. This reflects data from October 2015 – November 2016 that’s not seasonally adjusted.
- Violent crime rate. This factor looks at the number of violent crimes per 100,000 residents.
- Property crime rate. This metric looks at the number of property crimes per 100,000 residents.
- Dining and entertainment establishments per 100,000 residents.
After we ranked each hockey town using all nine of our factors, we averaged our rankings (giving half weight to our two crime-related factors and full weight to the other metrics) and calculated separate scores for our two categories. Then we averaged the fan intensity score and the quality of life score and came up with an index score. The highest-ranking hockey town received a 100 while the lowest-ranking town scored a 0.
Note that we did not consider women’s college hockey teams in our analysis, since there was not enough data available. We excluded teams in the National Women’s Hockey League as well, although we hope to include them in future studies.
Also, note that we left out all Canadian teams and excluded teams from three towns that didn’t have crime data (Hamilton, Uniondale and West Point, New York). Finally, we left out Tempe, Arizona. The Arizona State Sun Devils’ hockey team plays home games in two stadiums and there’s no attendance or stadium capacity data available.
Data Sources
Data on team attendance comes from echl.com, hockeydb.com, uscho.com and espn.com. Data on housing costs, population and household income are five-year estimates from the U.S. Census Bureau’s 2015 American Community Survey.
Crime rates come from the FBI’s Uniform Crime Reporting database. Unemployment rates come from the Bureau of Labor Statistics. Data on dining and entertainment establishments comes from the Census Bureau’s 2014 Zip Code Business Patterns database.
The data analysis for this study was completed by Nick Wallace.
Questions about our study? Contact us at press@smartasset.com.
Photo credit: ©iStock.com/sturti