 Written by
Marching. Donating to your favorite causes. Calling your congressman. You may be wondering what else you can do to make a difference in the current political climate. What about moving? Some 2016 congressional races were so tight that just a few thousand votes decided to winner. SmartAsset crunched the numbers to find the places in the country with tight congressional races where your votes can most make the difference in the 2018 midterm elections.
Compare mortgage rates here.
Study Specifics
In order to find the best swing districts to move to, SmartAsset began by looking at all congressional districts. To create a list of swing districts, we found every congressional district where the margin of victory in the November 2016 election was less than 15%. We then gathered data on how close those races were. Next we looked at livability factors like median income, median housing costs, the poverty rate, the unemployment rate and income inequality to create our ranking. To see where we got our data and how we put it together, read the data and methodology section below.
Key Findings
- Battleground Minnesota – Of the eight congressional districts in Minnesota, five of them had a margin of victory less than 15% in November 2016. Of those five, four cracked our top 10 for the best congressional districts to move to. In fact, Minnesota is a pretty good state for political junkies. We previously found that Minneapolis is one of the best cities for liberals.
- An even split – Of the swing districts we analyzed, 38 seats are held by Republicans and 37 are held by Democrats. As for our top 10, Democrats currently hold six of those seats and Republicans hold four.
- It’s not all about the swing – The closest race in our study, California’s 49th district, was decided by only 0.5% of the vote in the 2016 congressional election. However the area’s high housing costs and high income inequality keep it out of our top 10.
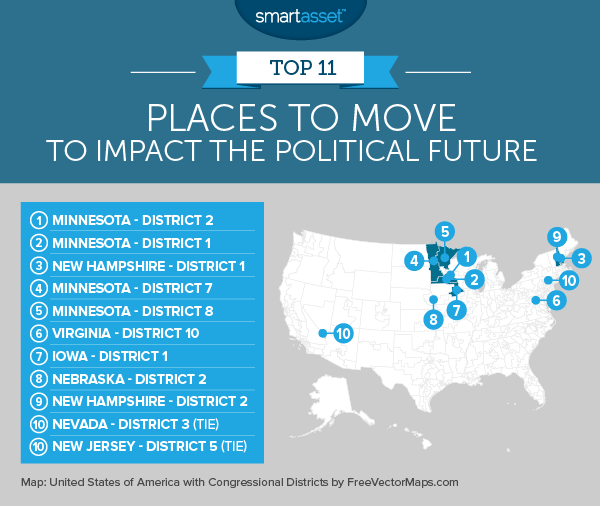
1. Minnesota’s 2nd Congressional District
In November 2016, Republican Jason Lewis won the seat for Minnesota’s 2nd congressional district by a mere 1.8%. In terms of votes, that equaled about 6,700 votes. Given such a small margin, moving here could potentially make a big difference in either flipping this seat or keeping it red come 2018.
This congressional district also has a very low poverty rate of 6.9% (the ninth-lowest of any swing district in our study) and a low unemployment rate of 3.7% (the sixth-lowest of any swing district). The main drawback of living here is the housing costs. Median housing costs in Minnesota’s 2nd congressional district are above $1,200 per month.
2. Minnesota’s 1st Congressional District
Democrat Tim Walz has represented Minnesota’s 1st congressional district since he took office in 2006. During that time, he has faced strong challengers and the races are getting progressively tighter. In 2008, he won with 62.5% of the vote and in 2016 he won with only 50.34% of the vote. That leaves this seat with the third-tightest contest of any we analyzed.
For those looking to change politics in Minnesota and looking to keep housing costs low, Minnesota’s 1st congressional district may be the place to be. Median monthly housing costs are only $808 per month, the 13th-lowest of any district in our study.
3. New Hampshire’s 1st Congressional District
Carol Shea-Porter, a Democrat, holds New Hampshire’s 1st congressional district in one of the most politically engaged states in the nation. She won the 2016 election by 1.3%, with a difference of about 4,700 votes.
That tight race propelled the district up our list but it also ranked well on its livability factors. New Hampshire’s 1st congressional district has the fourth-lowest income inequality in our study and the poverty rate is a low 7.8%
4. Minnesota’s 7th Congressional District
Collin Peterson, a Democrat, won Minnesota’s 7th congressional district by about 5% which equaled around 16,000 votes in 2016. He has held this seat since 2002 and the race has gotten tighter, though less so than in many other swing districts on our list. The reason this district ranks so high are its livability scores. The unemployment rate here, for example, is only 3.3% and monthly housing costs will only set you back $740 per month on average.
5. Minnesota’s 8th Congressional District
The fourth and final Minnesota district to crack our top 10 is the 8th congressional district. This was the second-closest congressional race in the nation last November, with Democrat Rick Nolan winning by only about 2,140 votes or 0.6% of the total. Moving here could potentially help your party’s chance of winning more than almost any other district in the top 10. Plus, its unemployment rate is pretty low at 4.3%. The median housing costs here are only $814 per month.
6. Virginia’s 10th Congressional District
Old Dominion’s 10th congressional district takes the sixth spot on our list. Republican Barbara Comstock won this seat by a relatively comfortable 5.8%. That was the equivalent of around 23,200 votes. If you’re thinking about relocating, there are plenty of reasons to choose Virginia’s 10th congressional district. For starters, this is the highest-earning swing district, with residents making a median annual income of $46,561. Plus, only 3.5% of residents are unemployed and around 5.2% find themselves below the poverty line.
7. Iowa’s 1st Congressional District
The sole Iowa area on our list is the state’s 1st congressional district. Republican Rod Blum won his seat by a more comfortable margin than any other winner in our top 10. He won by 7.7% or about 30,000 votes. One encouraging sign for Democrats, however, is that this is not traditionally a super conservative area. Obama won this district in 2008 and 2012, with over 56% of the vote. Last November, Trump won with only 48% of the vote.
If you do decide to move here, get ready for low unemployment and low housing costs. This district rank second and seventh in those metrics, respectively
8. Nebraska’s 2nd Congressional District
Don Bacon was the only Republican to defeat an incumbent Democrat in the 2016 house elections. But his was a close race and will likely continue to be so going forward. In 2016, Bacon won this seat by just 1.2% or 3,400 votes. If you do decide to move here, finding employment should not be too difficult. Nebraska’s 2nd congressional district has the second-lowest unemployment rate in our study.
9. New Hampshire’s 2nd Congressional District
Annie Custer, a Democrat, currently holds the seat for New Hampshire’s 2nd congressional district. She has held this seat since 2012, facing off three different Republican opponents during that time but winning by no more than 5% in any of those races. In 2016, she won by 4.4% or about 15,000 votes.
Moving to New Hampshire’s 2nd congressional district will put you in a place with low income inequality and a low unemployment rate. For both those metrics this district ranks in the top 10.
10. (tie) Nevada’s 3rd Congressional District
Finishing off our list is Nevada’s 3rd congressional district. Democrat Jacky Rosen currently holds this seat, after defeating Danny Tarkanian by 1.3% in November (about 4,000 votes). This race featured two newcomers after the incumbent, Joe Heck, decided to run for Senate. The median annual income in this district is $33,304 and the poverty rate is 8.7%. Both scores are good enough to rank in the top 20.
10. (tie) New Jersey’s 5th Congressional District
Tied in the 10th spot with Nevada’s 3rd congressional district is New Jersey’s 5th congressional district. This district tends to lean conservative. In each of the past five presidential elections it has gone to the Republican candidate, though it tends to be by a narrow margin. For example, Trump won this district by only 1%. Josh Gottheimer, a Democrat, won this district in a similarly close fashion, beating his opponent by 4.4% in November.
This district ranks well on some of our livability factors. Specifically, it has the fifth-highest median income of any district in our study and the third-lowest poverty rate.
Data and Methodology
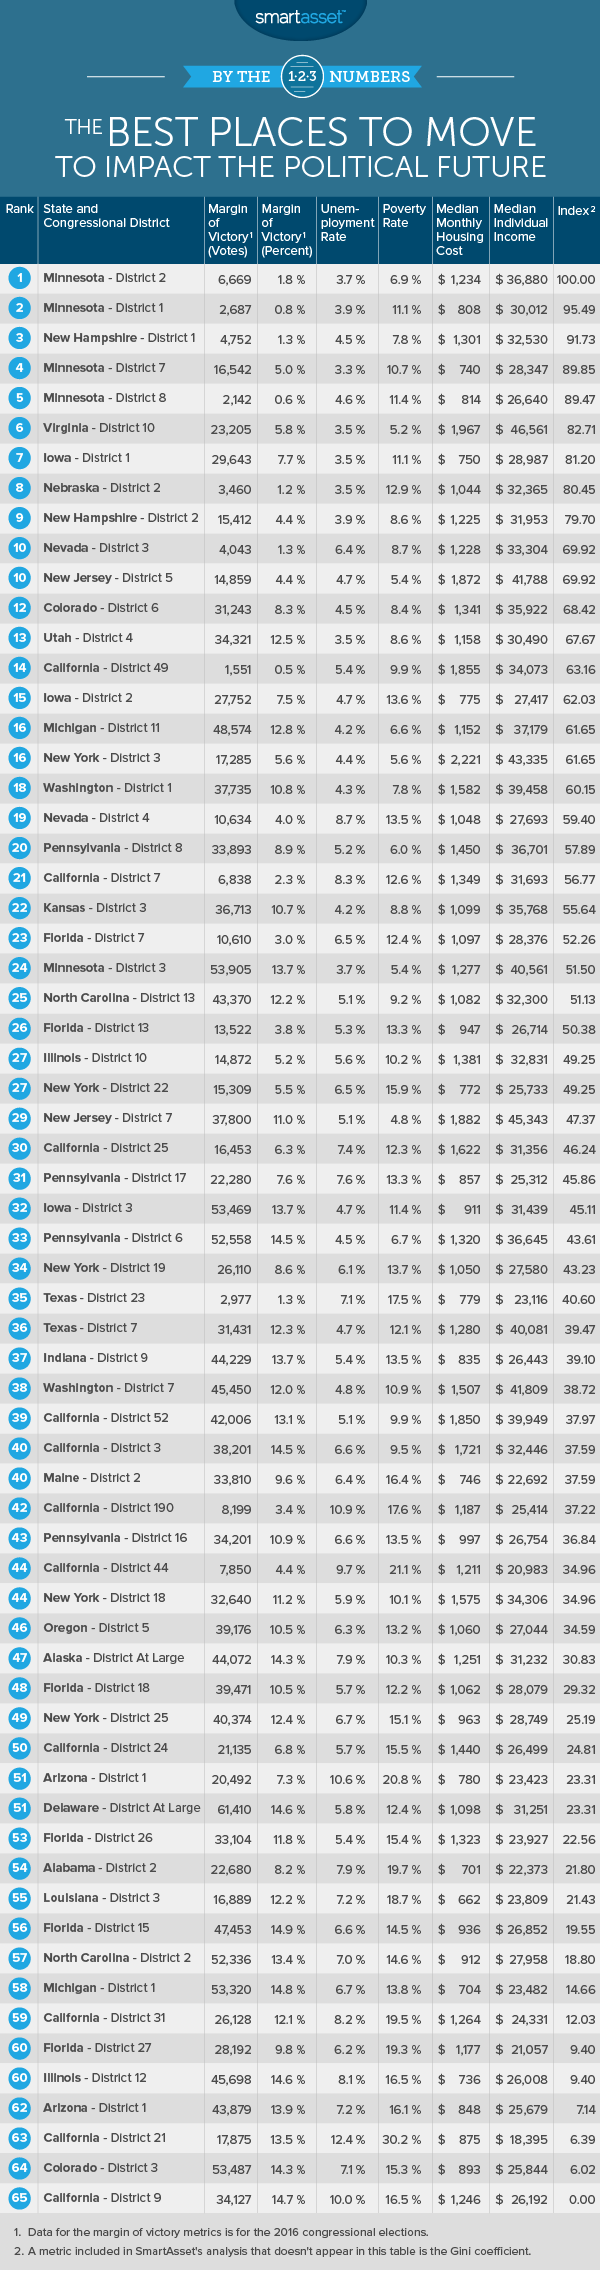
In order to find the best places to move to make a difference in the 2018 midterm elections, we looked at data on all 65 congressional districts where the margin of victory in the 2016 election was less than 15%. Specifically we looked at data in the following seven factors:
- Margin of victory (by votes). Races which were closer we ranked higher. Data comes from Ballotpedia and is for the 2016 congressional elections.
- Margin of victory (by percent). Races which were closer we ranked higher. Data comes from Ballotpedia and is for the 2016 congressional elections..
- Unemployment rate. Data comes from the Census Bureau’s 2015 1-Year American Community Survey.
- Poverty rate. Data comes from the Census Bureau’s 2015 1-Year American Community Survey.
- Income inequality. To measure income inequality, we used the Gini coefficient for each district. The Gini coefficient measures how income is distributed within a society. The Gini coefficient gets higher as more of a society’s income is held in fewer hands. Data is from the Census Bureau’s 2015 1-Year American Community Survey.
- Median monthly housing costs. Data comes from the Census Bureau’s 2015 1-Year American Community Survey.
- Median annual individual income. Data comes from the Census Bureau’s 2015 1-Year American Community Survey.
First we ranked each district across each of the seven metrics, giving each metric equal weight. Then we found the average ranking for each district. We used the average ranking to create a score for each district. The district with the highest-average ranking received a score of 100 and the district with the lowest-average ranking received a score of 0.
Questions about our study? Contact us at press@smartasset.com.
Photo credit:©iStock.com/franckreporter