 Written by
Editor’s Note: This study was originally published in August 2018.
Like any good financial advisor will tell you, investing is about more than just average return. The best investors weigh risk with reward. For example, consider home values. The Census Bureau estimates that the median home in the U.S. increased in value by $10,500 from 2015 to 2016. But that’s just the average increase. Some homeowners made more, some made less and some even lost money on their mortgages. Knowing exactly how your home’s value will change in the future is impossible, but with a little research you can get a better idea of the risks that come with investing in any city’s housing market.
Below we look at data on home values over time in order to find the odds of a significant depreciation in value and overall appreciation. Specifically, we compared home value data for every quarter between 1993 and 2017. To see how we created our final ranking, check out the data and methodology section below.
Key Findings
- Colorado boulders the competition – Colorado has three metro areas in our top 10, more than any other state. In fact if we also consider Wyoming, Colorado’s neighbor to the north, half of the top 10 housing markets for growth and stability are located in just two states.
- More of the same – Certain housing markets continue to pay dividends for homeowners who invested in them. The top three metro areas from last year’s ranking each kept their spots in this year’s edition.
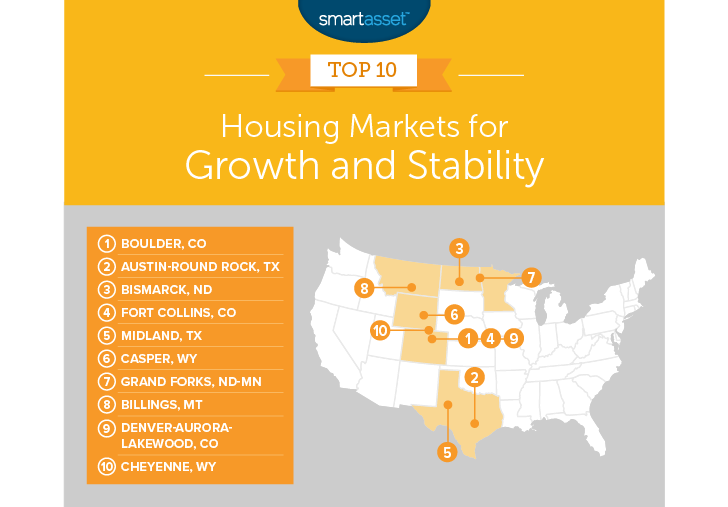
1. Boulder, CO
Home buyers have not been disappointed by the performance of the Boulder housing market. According to our data, the average home has grown 276% in value over the past 25 years. During the same time period, Boulder one of the most stable housing markets in the nation. It’s also a major reason why Boulder tops this ranking for the fourth straight year.
2. Austin-Round Rock, TX
Austin-Round Rock, Texas is another metro area that has seen stunning housing market growth over the past few decades. According to our research, if you had bought a home 25 years ago in Austin, on average you would have seen it appreciate in value by 243%. To put that into dollar terms, a home you bought in 1993 for $100,000 would be worth $243,000 today. Austin-Round Rock was also a dependable housing market. This metro area came in tied for first with the lowest incidence of a significant price decline.
3. Bismarck, ND
Coming in just behind Austin-Round Rock and Boulder is Bismarck, North Dakota. Like the previous cities, your odds of taking a loss on a home in Bismarck were exceptionally low, and average home values increased greatly. We estimate that from from 1993 to 2017, the home values grew by 224%.
4. Fort Collins, CO
Fort Collins is the second of three Colorado cities to find a spot in the top 10. Investing in Fort Collins real estate was slightly riskier than any of the top three cities on this list. We estimate there was a 4% chance that a homeowner could have suffered a significant decline in the value of their home. But with that extra risk, Fort Collins also offered investors potentially higher returns. Fort Collins ranks second for average growth in home value over the period we analyzed.
5. Midland, TX
Midland, in Western Texas, takes fifth. This metro has one of the lowest unemployment rates in the country, a sign of a strong local economy that can support a strong local housing market. Over the period we analyzed, Midland homes had a low chance of significant price declines, along with some of the highest growth figures. And while growth of 214% is impressive, if Midland wants to catch up to the other top cities, it will need to bump that figure up even higher.
6. Casper, WY
Wyoming has two metro areas in this top 10. Up first is Casper. This metro area saw stunning growth in home prices from 1993 to 2017. Over that time period the average home increased in value by 233%. However, we estimate that investing in the Casper housing market yields a 9% chance of suffering a loss (of at least 5%) in home value over any 10-year period from 1993 to 2017.
7. Grand Forks, ND-MN
Grand Forks, home to one of America’s best hockey towns comes in seventh. This metro was a safe place to dock a down payment and buy a home. According to our data, the metro area is tied for first for stability. Unfortunately, the overall returns to owning a home here weren’t as high as in other cities.
8. Billings, MT
Montana’s largest city cracks the top 10. If you had bought a home here in 1993, odds are that you would have seen pretty good returns. From then until 2017, the average home price increased by 178%. While those returns are not as high as other cities on this list, you could invest here without too much concern. The odds of finding yourself underwater on your mortgage were particularly low in Billings, according to data from the Federal Housing Administration.
9. Denver-Aurora-Lakewood, CO
As mentioned, Colorado was a great place to invest in housing in the past. The third Colorado metro area to crack this top 10 is Denver-Aurora-Lakewood. This housing market was the riskiest to invest in among the top 10. According to our data, Denver-Aurora-Lakewood homeowners had an 18% chance of seeing a significant decline in their home’s value over any 10-year period (between 1993 and 2017). However, the area also had some of the most upside. Over the whole 25 years we analyzed, the average home price increased by 256%.
10. Cheyenne, WY
Cheyenne rounds out our top 10. This was another metro area where your home investment was relatively safe from wild price fluctuations. Our data shows that the metro saw no significant declines in home value over any 10-year period. Cheyenne fell just short of the cities ranked above it due to returns that were closer to the 25-year average. From 1993 to 2017, the median home increased in value by 171%.
Data and Methodology
To create our ranking of the best housing markets for growth and stability we looked at data for 359 metro areas. Specifically we compared them across the following two metrics:
- Stability. This is the probability a homeowner experienced significant price declines (5% or more) at any point in the 10 years following the home purchase during the subject time period.
- Overall home price growth. This is the growth in home prices over the subject time period.
We indexed then averaged the two metrics to create our final ranking. The metro with the highest average score ranked first, and so on. All data comes from the federal housing administration and covers the period from 1993 to 2017.
Tips for Investing in the Housing Market
- If you’re thinking of investing in the housing market, it can helpful to talk to a financial advisor. Finding the right financial advisor that fits your needs doesn’t have to be hard. SmartAsset’s free tool matches you with financial advisors in your area in 5 minutes. If you’re ready to be matched with local advisors that will help you achieve your financial goals, get started now.
- Investing a ton of money in any single asset is risky. If you do invest in the housing market, make sure you invest in homes that you can afford. You may end up taking a big loss if the home depreciates and you can’t afford your mortgage. Our how much home can I afford calculator can help you with all the math.
- Most of your focus will be on paying your mortgage. But depending on where you live, property taxes can put a major dent in your housing budget. Illinois property taxes and New Jersey property taxes are some of the highest in the nation while Hawaii property taxes are some of the lowest.
Questions about our study? Contact us at press@smartasset.com.
Photo credit: ©iStock.com/SWKrullImaging