 Written by
Many states and localities that enacted shelter-in-place orders with the onset of the coronavirus crisis are now carefully implementing phased plans to reopen. With air travel not as available or carefree an option as before the pandemic, Americans are looking for safety on the road as their summer plans take shape. But staying safe while roadtripping, which can prevent significant dents in your savings, also depends on where you’re driving. That’s why SmartAsset decided to analyze the data to find the states with the worst drivers.
To find the states with the worst drivers, we considered four metrics: percentage of drivers who are insured, number of driving under the influence (DUI) arrests per 1,000 drivers, number of fatalities per 100 million vehicle miles driven and how often residents google terms like “traffic ticket” or “speeding ticket.” For details on our data sources and how we put all the information together to create our final rankings, check out the Data and Methodology section below.
This is SmartAsset’s fourth annual study on the states with the worst drivers. See the 2019 version here.
Key Findings
- Mississippi ranks worst for the third straight year. Mississippi drivers take the rear for the third year in a row. The state comes in second-worst in two different metrics, its high number of fatalities per 100 million vehicle miles driven and its low percentage of drivers who are insured.
- Massachusetts performs best. Though people who have to drive every day in Boston may disagree, Massachusetts has the fewest bad drivers in the nation, according to our study. The Bay State ranks within the best 10 states for three of the four metrics we considered, including having the fewest fatalities in the study per 100 million vehicle miles driven.
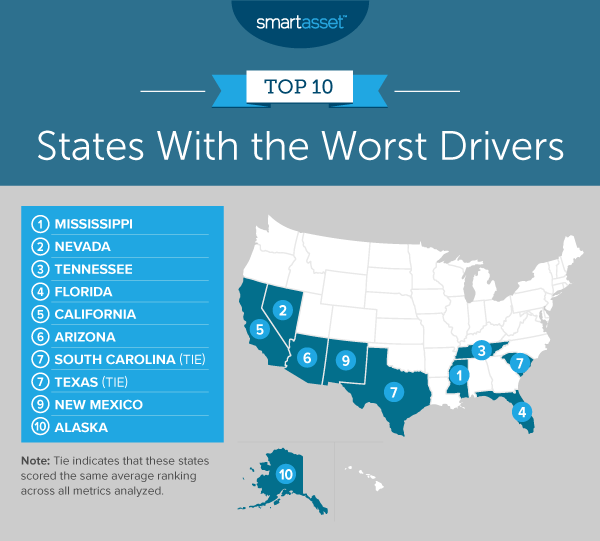
1. Mississippi
Mississippi has the second-highest rate of fatalities per 100 million vehicle miles driven, at 1.63. The state also ranks second for the lowest percentage of drivers insured, at just 76.3%. Mississippi also has the sixth-highest ratio of Google searches for “speeding ticket” or “traffic ticket” relative to searches for “gasoline,” at 2.03.
2. Nevada
Nevada has the fourth-highest rate for the Google search metric, with searches for “speeding ticket” or “traffic ticket” coming up 2.23 times more often than searches for “gasoline.” The state also ranks eighth-worst for its high number of DUI arrests per 1,000 drivers, at 5.54. Nevada ranks in the worst half of the study for the number of fatalities per 100 million vehicle miles driven, at 1.17.
3. Tennessee
Tennessee has the fifth-lowest rate of insured drivers, at around 80%. That means a full one-fifth of drivers on the road in the Volunteer State are uninsured. Tennessee also has the 12th-highest rate for the Google search metric we considered in our analysis, with ticket-related searches occurring 1.63 times as often as searches related to gasoline.
4. Florida
Florida has the lowest rate of insured drivers in the study. Just 73.3% of drivers in the state are insured. Florida also has the 10th-highest Google search ratio in the study, with ticket-related searches coming up 1.70 times more often than gasoline-related searches. There are 1.41 fatalities per 100 million vehicle miles driven in Florida, the 11th-highest rate for this metric in the study.
5. California
California ranks in the worst 15 of all states for three metrics. It has the 12th-highest number of DUI arrests per 1,000 drivers, at 4.71. It has the 11th-lowest percentage of drivers who are insured, at 84.8%. Finally, it has the 10th-highest rate in the study for the ratio of Google searches for “speeding ticket” or “traffic ticket” relative to searches for “gasoline,” at 1.70.
6. Arizona
Arizona has the third-highest number of fatalities per 100 million vehicle miles driven, at 1.53. The state doesn’t rank in the worst 10 of the study for any other metric, but does have the 14th-highest rate for the Google search metric we considered, with a ratio of 1.50 for ticket-related searches relative to gasoline-related searches.
7. South Carolina (tie)
South Carolina has the highest number of fatalities per 100 million vehicle miles driven, at 1.83. The Palmetto State also has the ninth-highest ratio in the study for ticket-related Google searches relative to gasoline-related searches, at 1.78. The state finishes near the middle of the study in terms of DUI arrests per 1,000 drivers, at 3.95.
7. Texas (tie)
Texas finishes in the worst 20 of all states for three different metrics. It has the 17th-highest number of fatalities per 100 million vehicle miles driven, at 1.29. Its rate for drivers who are insured ranks 15th-lowest, at 85.9%. Additionally, the ratio of ticket-related Google searches to gasoline-related Google searches is 1.50, the 14th-highest rate for this metric in the study.
9. New Mexico
New Mexico has the third-lowest percentage of insured drivers in this study, at 79.2%. It also has the ninth-highest number of fatalities per 100 million vehicle miles driven, at 1.43. It is important to note, however, that it ranks relatively low for the ratio of ticket-related Google searches relative to gasoline-related Google searches, at 0.92.
10. Alaska
Alaska has the fifth-highest DUI arrests per 1,000 drivers, at 5.87. The state also has the sixth-highest number of fatalities per 100 million vehicle miles driven, at 1.46. Furthermore, it has the 10th-lowest rate in the study of drivers who are insured, at 84.6%.

Data and Methodology
In order to find the states with the worst drivers, we looked at data on all 50 states across the following four metrics:
- Fatalities per 100 million vehicle miles driven. Data comes from the National Highway Traffic Safety Administration and is from 2018.
- Arrests for driving under the influence per 1,000 drivers. Data on DUI arrests comes from the FBI. Data on number of drivers comes from the Department of Transportation. Data is from 2018. (2018 data was not available for Iowa, so 2017 data was used.)
- Percentage of drivers who are insured. Most recently available data comes from the Insurance Research Council and is from 2017.
- Google Trends on driving tickets. This is how often residents in each state google “speeding ticket” and “traffic ticket.” To control for the number of drivers in each state, we compared “speeding ticket” and “traffic ticket” Google Trends data to “gasoline” Google Trends data. We pulled data for the period between May 2019 and May 2020.
First, we ranked each state in each of the four metrics. Then we found each state’s average ranking, giving each metric equal weighting. We used the average rankings to create our final score. The state with the highest average ranking received a score of 100, while the state with the lowest average ranking received a score of 0.
Tips for Managing Your Money for the Long Road
- Expert financial direction. A financial advisor can help make sure you are prepared for anything that comes your way on the road of life. Finding a financial advisor that fits your needs doesn’t have to be hard. SmartAsset’s free tool connects you with financial advisors in your area in five minutes. If you’re ready to be connected with local advisors get started now.
- Be smart about car insurance. Make sure you know what kind of deal you’re getting on your car insurance – as there are various discounts available during the coronavirus crisis – and shop around to find the best rates.
- Kick your emergency fund into high gear. One of the best ways to prepare for an unexpected expense like a car accident, which can take a major financial toll, is to have an emergency fund. Again, though financial advisors typically recommend you should have savings that can cover at least three months’ worth of expenses, six months’ worth may be a better figure to shoot for during a recession.
Questions about our study? Contact press@smartasset.com
Photo credit: ©iStock.com/globalmoments