 Written by
Driving gives many Americans expanded access and mobility where they might otherwise have had limited options. But along with the freedom to roam around comes the responsibility of being a prudent driver, not only in terms of personal safety but financial protection as well. Whether it’s a serious accident that results in medical or car repair expenses or a traffic violation fine, mishaps on the road can put a dent in your savings account. That’s all the more likely when your neighbors have higher rates of speeding and driving under the influence. To help you become aware of where these negative driving patterns are the most prevalent, SmartAsset took another look at which states have the worst drivers.
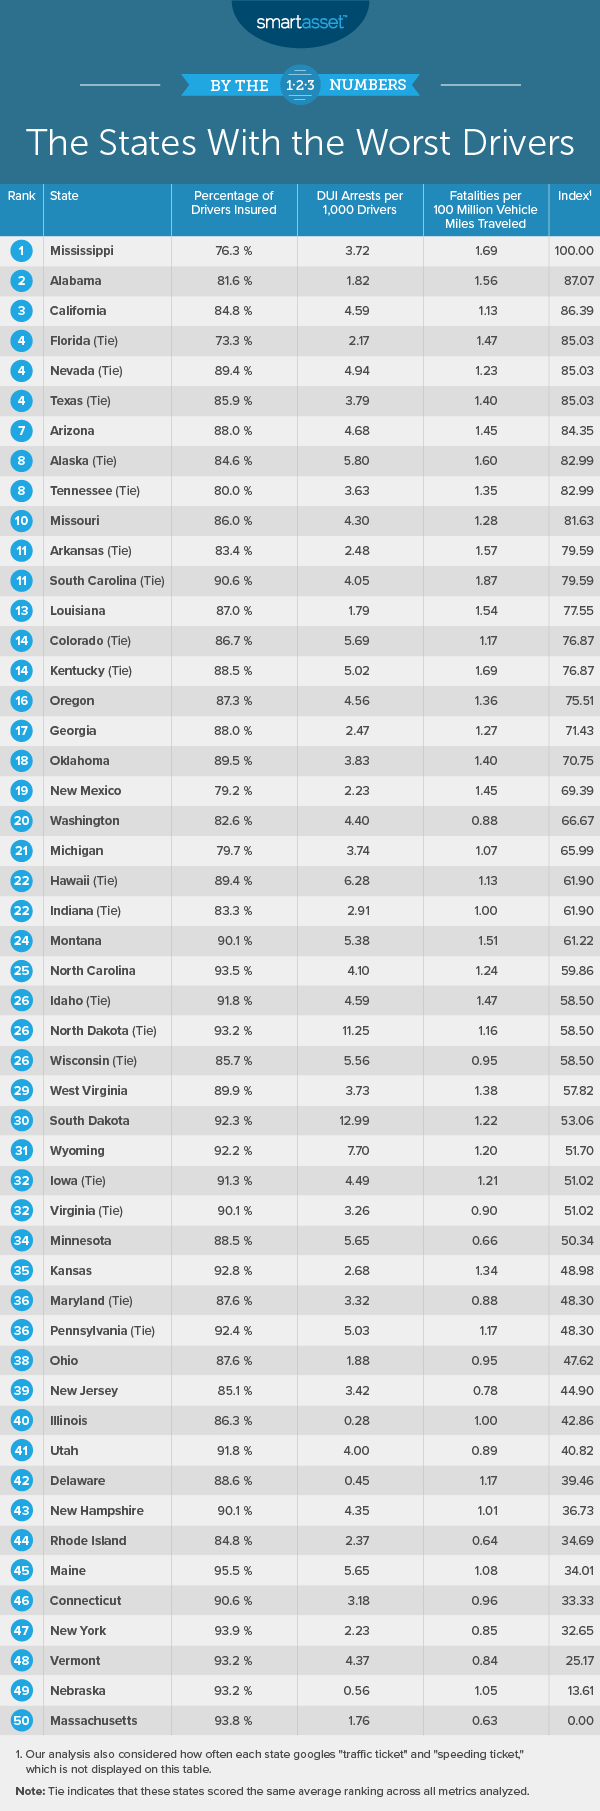
To find the states in America with the worst drivers, we considered four metrics. We looked at the percentage of drivers who are insured, the number of driving under the influence (DUI) arrests per 1,000 drivers, the number of fatalities per 100 million vehicle miles driven and how often residents google terms like “traffic ticket” or “speeding ticket.” For more details on our data sources and how we put that information all together to create our final rankings, see the Data and Methodology section below.
This is SmartAsset’s third annual study on the states with the worst drivers. See the 2018 edition of the study here.
Key Findings
- The South dominates the list. Once again, the South earns a reputation for bad drivers. Five of the top 10 states in this study are in the American South, including the top two states. No other region comes close to matching this poor driving record.
- Only New Mexico moves out of the top 10. Nine of the 10 states at the top of this year’s study were also in the top 10 of our 2018 study. New Mexico left its No. 5 spot in 2018 to move down to 19th-worst overall. The new top-10 state this year is Nevada, which ties for fourth-worst this year but was 14th-worst last year.
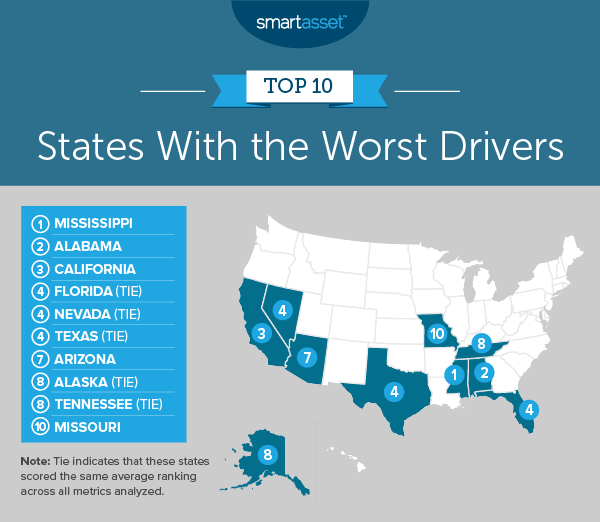
1. Mississippi
For the second year in a row, Mississippi tops this study and lays claim to the title of state with the worst drivers in the country. Just 76.30% of the drivers in the Magnolia State are insured, the second-lowest rate in this study. Mississippi has the eighth-highest search volume in our study for driving-related tickets, per Google Trends data. As far as fatalities go in Mississippi, 1.69 people die per 100 million vehicle miles driven, which ties with Kentucky for the second-highest rate in the study. That might be cause to up your life insurance policy. On the bright side, there are 3.72 DUI incidents per thousand drivers. That’s the 21st-fewest in this study.
2. Alabama
Another Southern state, Alabama, is next. Alabama has the sixth-lowest percentage in our study of insured drivers, just 81.60%. There are 1.82 DUI incidents per 1,000 drivers, which is actually the sixth-lowest rate for this metric in the study. But there are 1.56 fatalities per 100 million vehicle miles driven, though, and that is the sixth-highest rate overall. Google Trends data shows that Alabama also has the fourth-highest rate of searches for driving-related offenses such as speeding and traffic tickets.
3. California
California comes next. The Golden State has the sixth-highest rate of searches for speeding and traffic tickets. It also has the 12th-lowest percentage of insured drivers at 84.80%. The risk of for getting in an accident with an insured driver here may be something to discuss with your financial advisor. There are 4.59 DUIs issued per 1,000 drivers (the 15th-highest rate) and 1.13 fatalities per 100 million vehicle miles driven (the 20th-lowest rate).
4. Florida (tie)
There is a three-way tie for fourth place, starting with Florida. Just 73.30% of drivers in the Sunshine State have insurance, the lowest rate in the nation. The DUI rate, though, is the eighth-lowest in the country at 2.17 incidents per 1,000 drivers. Florida has the 11th-highest rate of searches for traffic-related tickets.
4. Nevada (tie)
Nevada is the next state in the three-way tie for fourth place. Insured drivers make up 89.40% of all drivers in the state, which is a higher percentage than that of 27 other states. Nevada doesn’t fare as well when it comes to DUIs, though – there are 4.94 DUI arrests per 1,000 drivers, the 13th-most in this study. Nevada also has the highest rate of searches for traffic-related tickets according to Google Trends data. You’ve worked hard to build your portfolio with your wealth management firm, so you don’t want a fender-bender to put a ding in your finances.
4. Texas (tie)
The final state in this fourth-place tie is Texas. The state has the ninth-highest rate of searches for traffic-related tickets and comes in the middle of the pack for DUIs per 1,000 drivers, at 3.79. The percentage of insured drivers is 85.90%, the 15th-lowest rate for this metric in the study. In terms of vehicle fatalities in the Lone Star State, 1.40 people are killed per 100 million vehicle miles driven.
7. Arizona
Arizona is next with an insurance rate of 88%, which is the 27th-highest rate in the nation. Arizona has 4.68 DUI incidents per 1,000 drivers and 1.45 people killed per 100 million vehicle miles driven. In terms of searches for driving related tickets, Arizona ranks 17th-highest. As you contribute to your 401(k) and handle your regular expenses, the last thing you want to do is fork over money to pay for a repair here. So take heed when driving in the Grand Canyon State.
8. Alaska (tie)
Tying for eighth place is Alaska. This state has 5.80 DUI incidents per 1,000 drivers. That’s the fifth-most in this study. Furthermore, there are 1.60 fatalities per 100 million vehicle miles driven in Alaska, the fourth-highest rate in the country. On the flip side, the state has the third-lowest rate of searches for traffic-related tickets. Driving styles here could be mirroring a good retirement investment strategy: relatively slow and steady.
8. Tennessee (tie)
Tied with Alaska for the eighth spot for the states with the worst drivers is Tennessee. Just 80% of Volunteer State drivers are insured, the fifth-lowest rate in the country. The state also sees 3.63 DUIs per 1,000 drivers and 1.35 fatalities per 100 million vehicle miles driven. It comes in 14th-highest for rate of searches for driving related tickets, according to Google Trends data.
10. Missouri
The final state in our top 10 is Missouri. Insured drivers make up 86% of all drivers in the state, the 16th-lowest rate in the country. There are 4.30 DUIs issued per 1,000 drivers and 1.28 fatalities per 100 million vehicle miles driven. The state ranks 12th-highest for rate of searches for driving-related tickets.
Data and Methodology
In order to find the states with the worst drivers, we looked at data on all 50 states. Specifically, we looked at data on the following four metrics:
- Fatalities per 100 million vehicle miles driven. Data comes from the National Highway Traffic Safety Administration and is from 2016.
- Arrests for driving under the influence per 1,000 drivers. Data on DUI arrests comes from the FBI. Data on number of drivers comes from the Department of Transportation. Data is from 2017.
- Percentage of drivers who are insured. Data comes from the Insurance Research Council and is from 2017.
- Google Trends on driving tickets. This is how often residents in each state google “speeding ticket” and “traffic ticket.” To control for the number of drivers in each state, we compared “speeding ticket” and “traffic ticket” Google Trends data to “gasoline” Google Trends data. We pulled data for the period between May 2018 and May 2019.
First, we ranked each state in each of the four metrics. Then we found each state’s average ranking, giving each metric equal weighting. We used the average rankings to create our final score. The state with the best average ranking received a score of 100, while the state with the worst average ranking received a score of 0.
Tips For Managing Your Money
- Financial road map. Navigating your finances can feel like an endlessly winding road, but a financial advisor can help steer you in the right direction. Find one with SmartAsset’s free financial advisor matching service. You answer a few questions and we match you with up to three advisors in your area, fully vetted and free of disclosures. You get a chance to talk to each advisor and decide which one you’d like to give the green light.
- Buckle down on your budget. If you’re looking to buy a car or purchase car insurance, do you have enough money to pay for it? If you’re not sure, taking a detailed look at your monthly expenses first might be a good idea. SmartAsset’s budget calculator can accelerate the process and help get you where you need to be.
Questions about our study? Contact press@smartasset.com Photo credit: ©iStock.com/Milkos