 Written by
Unions can be effective tools for collective bargaining. They represent workers in negotiations with management to uphold workers’ rights, including fair wages. According to a 2018 report on full-time workers from the Bureau of Labor Statistics (BLS), nonunion workers earned just 82% of the median weekly amount that union member workers earned. Being able to make a fair wage is necessary in order to budget properly and build up your savings account. But the power of unions in the U.S. varies significantly across different locations. Some states are union hotbeds, where organized labor is a major player in business and politics. In other states, unions don’t hold as much sway. SmartAsset decided to see where unions are the strongest.
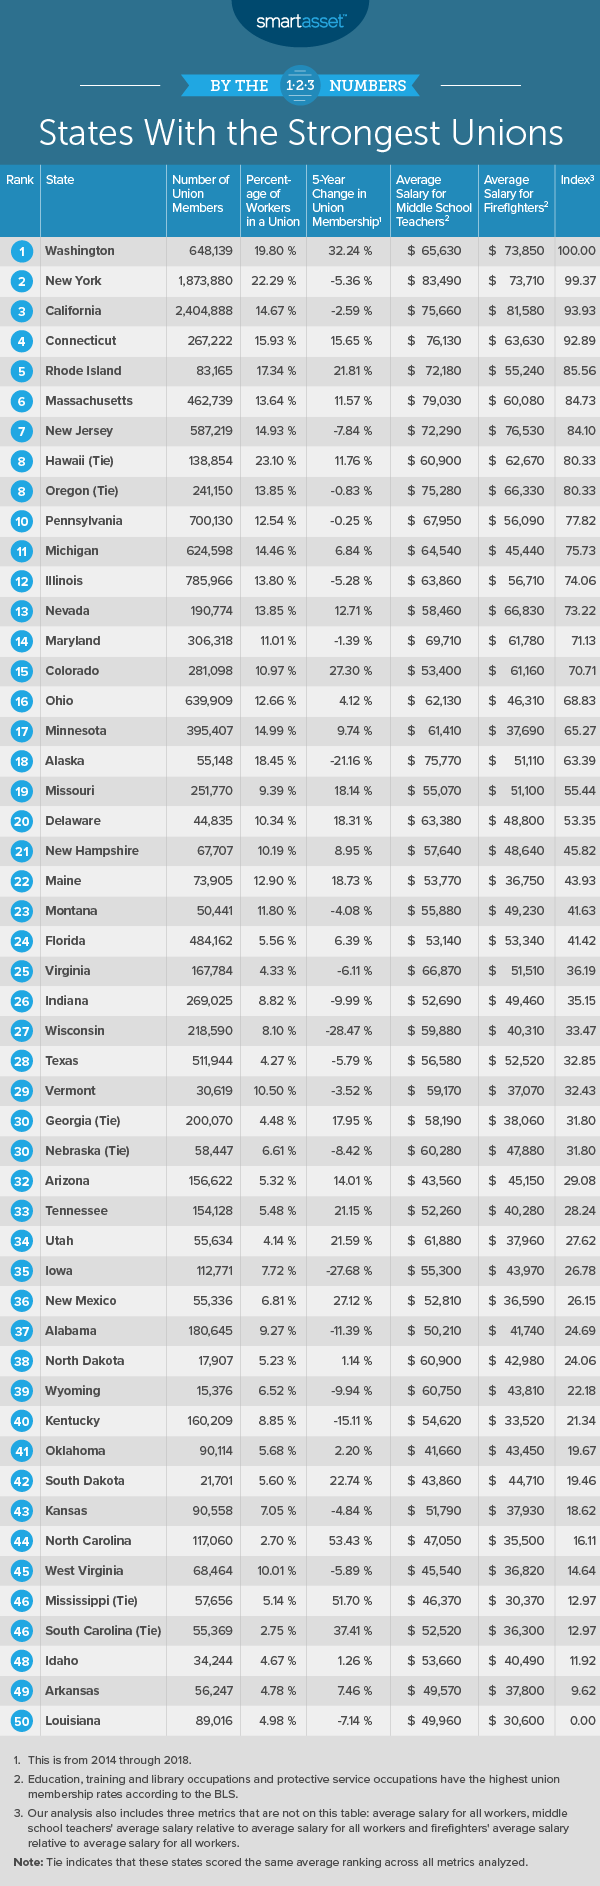
To find the states with the strongest unions, we analyzed data across the following eight metrics: number of union members, the percentage of workers who are union members, five-year change in union membership, average annual wage for all occupations, average annual wage for middle school teachers, the salary ratio of teachers to all occupations, the average wage for firefighters and the salary ratio of firefighters to all occupations. We looked specifically at teachers and firefighters, because according to the BLS, the highest unionization rates among occupational groups in 2018 were in protective service occupations (33.9%) and in education, training, and library occupations (33.8%). Firefighters and middle school teachers are prominent occupations within both of those industries and workers in these jobs tend to make salaries toward the middle of the ranges for all occupations within those industries. For details on our data sources and how we put all the information together to create our final rankings, check out the Data and Methodology section below.
Key Findings
- Unions are stronger on the coasts. The East Coast populates the top 10, with six states located in the Northeast. The other four states in the top 10 are either on the West Coast or in the Pacific. No states from the interior of the country are in the top 10.
- Unions are weaker in the South. Eight of the bottom 10 states in our study in are in the South. Many of them do particularly poorly in terms of number of union members and percentage of workers belonging to a union.
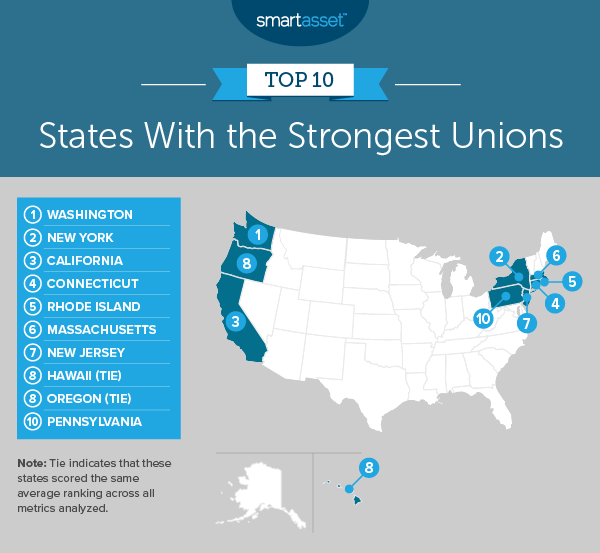
1. Washington
Washington State kicks off this list. It doesn’t lead any single metric but places in the top five for several. Washington has the third highest percentage of workers being union members, 19.80% and the fifth highest number of union members overall, more than 658,000. Washington also has the fourth highest annual wage for all occupations, $59,410.
2. New York
New York has the second-highest number of total union members, at more than 1.8 million. It also has the second-highest percentage of workers belonging to unions, 22.29%, and the second-highest annual wage for all occupations, $61,870. Middle school teachers in the state make $83,490 on average — the highest amount for this metric in the study.
3. California
California ranks third overall and it has the highest number of union members of any state, at more than 2.4 million. The percentage of workers in unions in California is just 14.67%, which ranks a bit lower than some other states in this top 10 but still come in ninth overall. Union membership in California has gone down 2.59% in the past five years. Firefighters in California earn $81,580 on average, the highest amount in the study. That is 137.92% of the average for all occupations, the second-highest ratio for this metric in the study.
4. Connecticut
The average annual wage across all occupations in Connecticut is $60,780, the third-highest in the study. Firefighters earn $63,630 on average, the seventh-highest average in the study. That’s 104.69% of the average across all occupations, a top-20 rate. Connecticut comes in sixth overall in terms of the percentage of workers in unions, at 15.93%
5. Rhode Island
In Rhode Island, middle school teachers earn an average of $72,180, the eighth-highest average in the study. That total is 131.69% of the average income across other professions, the fourth-highest ratio in the study for this metric. Around 17.34% of workers are part of a union, a top-five rate.
6. Massachusetts
Massachusetts leads the study in terms of average salary across all occupations, at $63,910. It ranks second for middle school teacher pay, at $79,030. There are more than 462,000 members of unions in Massachusetts, the 11th-highest amount for this metric in the study. Be sure to manage your tax liabilities properly here as you grow your wealth, though, as Massachusetts is the No. 4 state where it costs the most to be rich.
7. New Jersey
Firefighters in New Jersey earn $76,530 on average, the second-highest amount for this metric in the study. That income is 131.47% of the average wages across all occupations in the state, the third-highest ratio for this metric overall. New Jersey ranks within the top 10 for its total number of union members, at more than 587,000, and for the percentage of workers there who belong to unions, 14.93%.
8. Hawaii (tie)
Hawaii ranks first in the study for the number of union workers as a percentage of all workers, at 23.10%. It also ranks in the top 10 for both of the metrics related to firefighters. The average firefighter salary in Hawaii is $62,670, which is 118.47% of the average salary for all occupations in the state. Additionally, the state ranks 27th for its total number of union workers, which reaches more than 138,000.
8. Oregon (tie)
Oregon, which ties with Hawaii for the No. 8 spot in our top 10, has the sixth-highest average salary for teachers in this study, at $75,280. That is 144.77% of the average salary in all occupations in the state, the highest ratio in this study. There are more than 241,000 unionized workers in the state, and they represent around 13.85% of all workers in the state.
10. Pennsylvania
Pennsylvania rounds out our list of the top 10 states with the strongest unions. Teachers in the Keystone State make 135.82% of the average salary for all workers in the state, the second-highest ratio in this study. Although union membership has decreased slightly in Pennsylvania in the five-year period from 2014 through 2018, the state still has the fourth-highest total number of union workers in the study, at more than 700,000. Furthermore, approximately 12.54% of all workers belong to a union. And if you don’t want to work a union job into your elder years, note that Pennsylvania is one of the best states to retire early.
Data and Methodology
To find the states with the strongest unions, SmartAsset considered data from all 50 states across the following eight metrics:
- Number of union members. Data comes from UnionStats.com and is for 2018.
- Percentage of workers who are union members. Data comes from UnionStats.com and is for 2018.
- Five-year change in union membership. Data comes from UnionStats.com and is for 2014 and 2018.
- Average annual wage for all occupations. Data comes from the Bureau of Labor Statistics (BLS) and is for 2018.
- Average annual wage for middle school teachers. Data comes from the BLS and is for 2018. According to the BLS, among occupational groups, one of the highest unionization rates in 2018 was in education, training and library occupations. Middle school teacher is a prominent occupation within that industry. Workers in this job tend to make middle-range salaries for all occupations within the industry.
- Salary ratio for teachers to all occupations. Data comes from the BLS and is for 2018.
- Average annual wage for firefighters. Data comes from the BLS and is for 2018. According to the BLS, among occupational groups, one of the highest unionization rates in 2018 was in protective service occupations. Firefighter is a prominent occupation within that industry. Workers in this job tend to make middle-range salaries for all occupations within the industry.
- Salary ratio for firefighters to all occupations. Data comes from the BLS and is for 2018.
First we ranked each state in each metric. We then found the average ranking for each state, giving each state equal weight, except for the percentage of workers in unions, which received a double weight, and the four metrics regarding average annual wages and salary ratios for teachers and firefighters, each of which received a half weight. We then used the average rankings to create our final rankings. The state with the highest average ranking received a score of 100, and the state with the lowest average ranking received a score of 0.
Tips for Managing Your Money
- Smart financial partnerships. Whether or not you currently belong to a union, a financial advisor can help you make the most out of your salary. SmartAsset’s free tool matches you with financial advisors in your area in just five minutes. If you’re ready to be matched with local advisors that will help you achieve your financial goals, get started now.
- How much are you really taking home? No matter your salary, you’ll be impacted by taxes and other deductions. Calculate your take home pay with SmartAsset’s free paycheck tool.
Questions about our study? Contact press@smartasset.com
Photo credit: ©iStock.com/LPETTET