 Written by
According to a 2018 Gallup report, approximately four in 10 Americans would choose to live in a town, a small city or a suburb of a small city as opposed to big cities and rural areas. As Americans look for places that fit their lifestyle while allowing them to sock away savings, some small cities – defined as having at least 65,000 residents but fewer than 100,000 – have similar amenities to bigger cities while still offering the community feel that small towns do. Small cities may be additionally appealing in light of the coronavirus crisis, as there may be more access to parks and outdoor spaces in places with lower population densities.
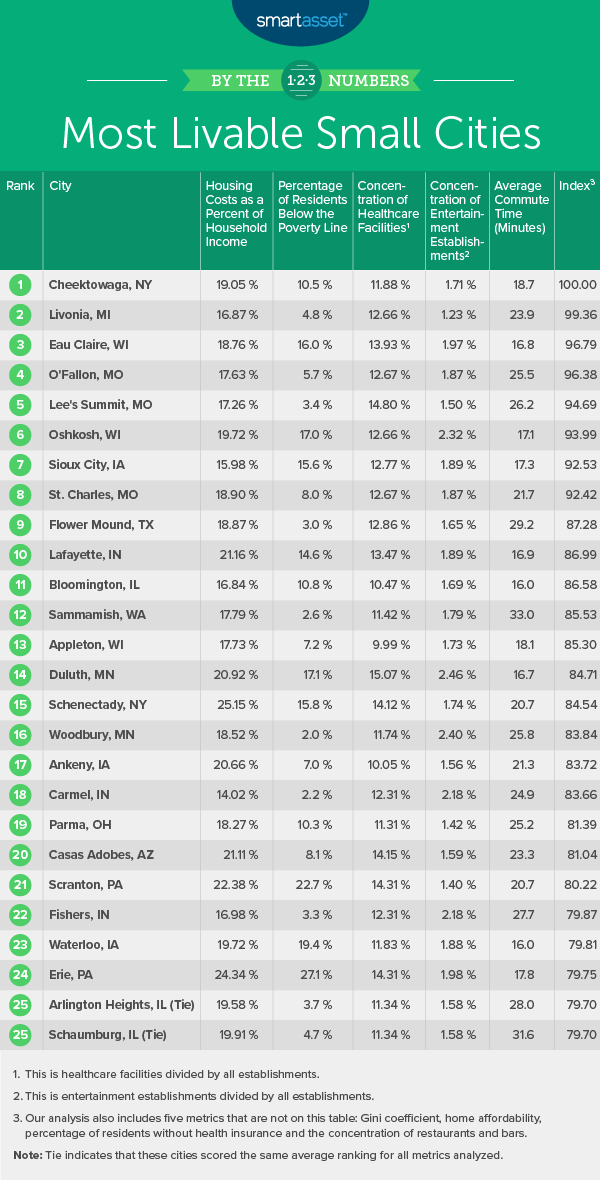
In this study, SmartAsset crunched the numbers to find the most livable small cities in the U.S. Entertainment establishments, restaurants and bars are slowly reopening nationwide and with that, more individuals will return to their daily routines. We compared 287 cities across the following 10 metrics: concentration of entertainment establishments, restaurants, bars and healthcare establishments; Gini coefficient (a measure of income inequality); home affordability; housing costs as a percentage of median household income; percentage of residents below the poverty line; percentage of residents without health insurance and average commute time. For details on our data sources and how we put all the information together to create our final rankings, check out the Data and Methodology section below.
This is SmartAsset’s third annual study of the most livable small cities. Read the 2019 study here.
Key Findings
- Heartland cities come in strong. Eight of the top 10 cities in the study are located in Midwestern states. This includes three in Missouri, two in Wisconsin and one each in Iowa, Michigan and Indiana. All eight cities rank within approximately the best 25% of the study for their relatively high concentration of healthcare establishments and home affordability. They also rank roughly within the top third of the study for their relatively low housing costs as a percentage of median household income.
- Shorter commutes. Though many individuals are currently working from home, commutes are likely to become part of people’s daily lives again as businesses reopen. Many small cities have the benefit of shorter commutes compared to large cities. Across all 287 small cities in our study, the average commute is roughly 26 minutes. By contrast, the average commute time in some large cities is close to 45 minutes. New York City, for example, has an average commute time of 42 minutes.
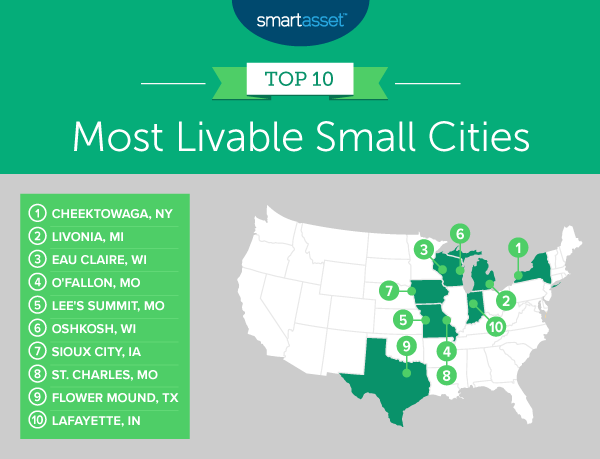
1. Cheektowaga, NY
A suburb of Buffalo in Western New York State, Cheektowaga leads our study on the most livable small cities in America. It ranks in the best 20% of the study for six of the 10 metrics we considered: concentration of bars, income equality, home affordability, housing costs, low percentage of residents without health insurance and average commute time. Specifically, Cheektowaga ranks 11th out of 287 small cities for home affordability, with a home value to household income ratio of 2.23. Additionally, Cheektowaga has the 31st-highest concentration of bars as a percentage of all establishments, at 0.8%. Cheektowaga also has the 33rd-lowest percentage in the study of residents without health insurance, at 3.7%.
2. Livonia, MI
Livonia, Michigan ranks ninth-best in our study for the metric of housing costs as a percentage of median income, at 16.87%. Located about 15 miles from Detroit, the city also has the 31st-lowest percentage of residents living below the poverty line, at less than 5%. For comparison, the average poverty rate across all 287 cities in our study is about 13%. Finally, Livonia ranks 16th for its low percentage of residents without health insurance, at 2.6%.
3. Eau Claire, WI
Eau Claire, Wisconsin has the second-highest concentration of bars in this study, at almost 2% of all establishments. The city also has the shortest average commute time across our top 10 and the 20th-shortest overall, at less than 17 minutes. Residents in Eau Claire additionally benefit from above-average healthcare accessibility. The concentration of healthcare establishments in Eau Claire is 13.9%, the 24th-highest percentage across all 287 cities for which we examined data.
4. O’Fallon, MO
O’Fallon is the first of three Missouri cities to rank among the top 10 livable small cities in the country. Located near St. Louis, O’Fallon is an affordable place to live. It has the 20th-lowest housing costs as a percentage of median income, at 17.63%. Additionally, it ranks 30th-best for home affordability, with a home value to household income ratio of 2.63.
5. Lee’s Summit, MO
Lee’s Summit, Missouri, located in the Kansas City area, has the 11th-lowest percentage in the study of residents below the poverty line, at 3.4%. It also has the 13th-lowest housing costs as a percentage of median household income, at 17.26%, and the 13th-highest concentration of healthcare facilities, at 14.8% of all establishments.
6. Oshkosh, WI
Oshkosh, Wisconsin leads the study in terms of concentration of bars, with bars comprising 2.6% of all establishments. Oshkosh also has the 21st-highest concentration of entertainment establishments in the study, at 2.3%. Additionally, it has the 25th-shortest average commute time to work, at roughly 17 minutes.
7. Sioux City, IA
Similar to Lee’s Summit, Sioux City, Iowa ranks well on our two affordability-related metrics: home affordability and housing costs as a percentage of household income. In 2018, it had a home value to household income ratio of 2.02, the third-lowest in our study. Additionally, median housing costs as a percentage of median household income was less than 16%.
8. St. Charles, MO
St. Charles, Missouri ranks 43rd of 287 small cities in terms of housing costs as a percentage of median income, at an affordable 18.90%. A suburb of St. Louis, St. Charles ranks in the top fourth of the study for its concentration of entertainment establishments, which comprise 1.9% of all its establishments.
9. Flower Mound, TX
Flower Mound, Texas ranks in the top 50 of all 287 cities for three metrics in the study: a high concentration of restaurants, low housing costs as a percentage of household income and a low percentage of residents below poverty line. The city has the 42nd-highest concentration of restaurants, at 8.6%. It has the 41st-lowest housing costs as a percentage of household income, at 18.87%. In addition, it has the eighth-lowest percentage of residents below the poverty line, at 3%.
10. Lafayette, IN
Lafayette, Indiana rounds out our list of the top 10 most livable small cities in the U.S. Residents in Lafayette may be looking forward to the reopening of the many restaurants in the area. Our data shows that Lafayette has the highest concentration of restaurants of any city in our top 10 and the 14th-highest overall. Additionally, Lafayette does well for our housing affordability metric. It ranks 31st-best for its home-value-to-household-income ratio of 2.65.
Data and Methodology
To find the most livable small cities in America, SmartAsset compared 287 cities with at least 65,000 people but fewer than 100,000 across the following 10 metrics:
- Concentration of entertainment establishments. This is the number of arts, entertainment and recreation establishments as a percentage of all establishments in a city. Data comes from the U.S. Census Bureau’s 2017 County Business Patterns Survey.
- Concentration of bars. This is the number of bars as a percentage of all establishments in a city. Data comes from the U.S. Census Bureau’s 2017 County Business Patterns Survey.
- Concentration of restaurants. This is the number of restaurants as a percentage of all establishments in a city. Data comes from the U.S. Census Bureau’s 2017 County Business Patterns Survey.
- Concentration of healthcare establishments. This is the number of healthcare and social assistance establishments as a percentage of all establishments in a city. Data comes from the U.S. Census Bureau’s 2017 County Business Patterns Survey.
- Gini coefficient. This is a statistical measurement of income inequality. A Gini coefficient of zero indicates total equality of wealth distribution while a coefficient of one indicates total inequality of wealth distribution across groups. Data comes from the U.S. Census Bureau’s 2018 1-year American Community Survey.
- Home affordability. This is the median home value divided by median household income. A lower ratio indicates that homes are more affordable and vice versa. Data comes from the U.S. Census Bureau’s 2018 1-year American Community Survey.
- Housing costs as a percentage of household income. This is the median housing costs divided by median household income. Data comes from the Census Bureau’s 2018 1-year American Community Survey.
- Percentage of residents below the poverty line. Data comes from the U.S. Census Bureau’s 2018 1-year American Community Survey.
- Percentage of residents without health insurance. Data comes from the U.S. Census Bureau’s 2018 1-year American Community Survey.
- Average commute time. This measures a worker’s average commute time in minutes. Data comes from the U.S. Census Bureau’s 2018 1-year American Community Survey.
First, we ranked each city in each metric. Next, we found each city’s average ranking, with each metric receiving an equal weight. We used this average ranking to create our final scores. The city with the highest average ranking received a score of 100 and the city with the lowest average ranking received a score of 0.
It is important to note that our 2019 study on the most livable small cities in the U.S. included an 11th metric, the unemployment rate in each city. Due to the drastic changes in unemployment during the coronavirus pandemic, we decided to exclude that metric from this year’s analysis.
Tips to Protect Yourself Financially
- Boost your emergency savings. Though one of the best ways to prepare for the unknown, AARP found in an October 2019 study that 53% of U.S. households have no emergency savings account. Take a look at our best savings accounts in 2020 to see where you can start saving. Typical financial wisdom suggests you should have savings that can cover three months’ worth of expenses, but six months’ may be a better figure to shoot for during a recession.
- Keep in mind the cost of living in different places. If you are thinking of moving from a small city to a big city or a big city to a small city, make sure you know what the cost of living is in that area. By knowing the average annual cost of living, you can figure out how far your salary will go and what your savings rate will be.
- Seek out trusted advice. No matter where you live, a financial advisor can help you get your financial life in order. Finding the right financial advisor who fits your needs doesn’t have to be hard. SmartAsset’s free tool matches you with financial advisors in your area in five minutes. If you’re ready to be matched with local advisors that will help you achieve your financial goals, get started now.
Questions about our study? Contact press@smartasset.com
Photo credit: ©iStock.com/DNY59