 Written by
Small towns have their charm and big cities offer great opportunities, but what if you’re looking for something in between? Unlike a large metropolis, a small city tends to have a more affordable cost of living, making it easier to build your savings for a house or retirement. It’s also possible to find a great quality of life without completely sacrificing job opportunities, as you might have to do in an even smaller town. To shine a light on these great locales, SmartAsset created this list of the most livable small cities in the U.S.
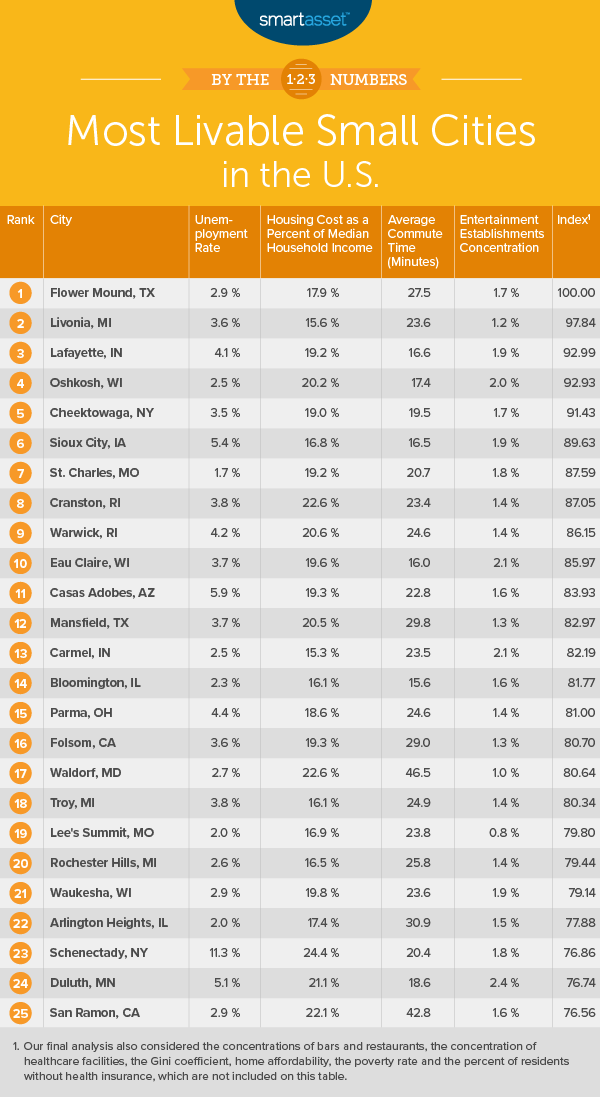
We completed this study of the most livable small cities by considering more than 200 cities that have a population between 65,000 and 99,999. We looked at 11 factors: concentration of entertainment establishments, concentration of restaurants, concentration of bars, the Gini coefficient (a measure of income inequality), home affordability, housing costs as a percentage of median income, percentage of residents living below the poverty line, unemployment rate, percentage of residents without health insurance and average commute time. You can learn more about the factors we considered and how we put them together to create the final rankings by checking out the Data and Methodology section below.
This is SmartAsset’s second annual study of the most livable small cities. You can find the 2018 version here.
Key Findings
- Low turnover at the top. The two most livable cities for 2019, Flower Mound at No. 1 and Livonia at No. 2, are the same as last year. And while Livonia has closed the gap on Flower Mound, the top two have distanced themselves from the rest of the pack. All told, six of the top 10 cities from last year also rank in this year’s top 10.
- Affordability and monthly housing aren’t the same. The affordability of housing is a major focus of this study. However, the cities in our top 10 don’t necessarily have the lowest monthly housing costs. The median monthly housing costs across the top 10 (approximately $1,071) are only about $100 less than the monthly costs for the bottom 10 cities (approximately $1,171). More important than just monthly housing costs are median incomes and the income equality in a city.
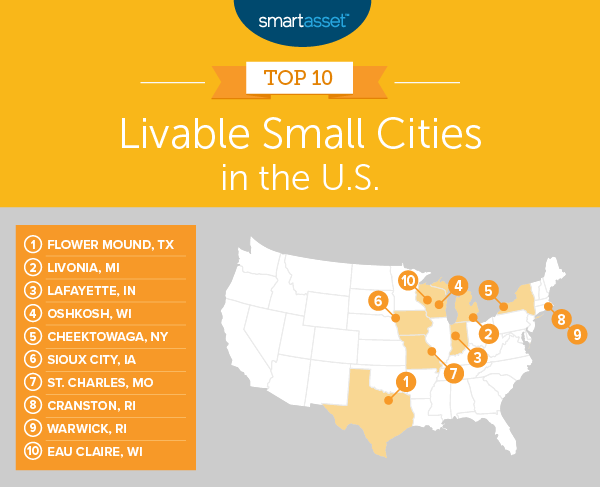
1. Flower Mound, TX
This is the second year in a row that Flower Mound, Texas has topped our list of the most livable small cities. The costs of housing relative to median household income is relatively low in Flower Mound, with the average household spending 17.90% of its income on housing. The Dallas suburb ranks in the top 20 overall in this metric.
Only 2% of the city’s residents are below the poverty line, which is the lowest percentage of any city in our top 10. Flower Mound also ranks well in terms of employment. The city’s unemployment rate is 2.90%. One of the downsides, however, may be the commute time here. The average commute in Flower Mound is 27.50 minutes, which is the longest commute of any city in our top 10.
2. Livonia, MI
Livonia, Michigan also landed second on our list of livable small cities last year. Located in the western suburbs of the Detroit metro area, it ranks 13th in our study for home affordability. The average home in Livonia is worth 2.31 times the median household income there. The city also ranks well in terms of housing costs compared to median household income. The average household in Livonia spends 15.62% of its income on housing.
Out of any city in the top 10, Livonia also has the lowest percentage of residents – 3.00% – without health insurance. In our top 10, Livonia also has the second-lowest percentage of the population living in poverty, with 5.60% of residents below the poverty line.
3. Lafayette, IN
Lafayette, Indiana makes its debut this year in our list of top 10 livable small cities. Lafayette ranks particularly well in terms of the number of entertainment options, restaurants and bars. An impressive 8.91% of Lafayette’s total establishments are restaurants, which is the highest percentage of any of the cities in the top 10. In addition to ranking 11th overall for restaurants, Lafayette ranks 24th overall in terms of bars as a percent of all establishments.
Lafayette also boasts low commute times. The average commute is 16.60 minutes, which is the third-shortest commute in the top 10. The city also rates well in terms of home affordability. The average home in Lafayette is worth 2.32 times the median household income. On the downside, Lafayette has the second-highest percentage of people living below the poverty line – 18.80% – of any city in our top 10.
4. Oshkosh, WI
Oshkosh, Wisconsin is one spot higher on our list this year than it was in 2018. Notably, the city ranks first overall in the metric of bars, with bars accounting for 2.61% of all establishments there. It also ranks 34th overall for entertainment establishments, making this an appealing small city for someone who values arts, entertainment and recreation options.
Oshkosh ranks well in ways other than having fun, too. It has an unemployment rate of 2.50%, the second-lowest of any city in the top 10. It ranks 27th overall for commute time, which averages around 17.40 minutes.
5. Cheektowaga, NY
Though it’s two spots lower than it was last year, Cheektowaga, New York still ranks well in several metrics. The second-largest suburb of Buffalo, the city ranks especially well for home affordability. It’s sixth overall in this metric, with the average home value 2.13 times the median household income there. An average Cheektowaga household spends about 18.95% of its income on housing.
If you like to kick back and relax with a drink, then Cheektowaga may be a good fit. The city ranks in the top 30 of our study for its concentration of watering holes, with bars comprising 0.89% of all establishments in the city.
6. Sioux City, IA
Sioux City, Iowa has held strong in the sixth spot from our 2018 list. The city in northwestern Iowa has a top-10 score for home affordability. The average home in Sioux City is worth 2.17 times the median household income. The average household spends 16.83% of its income on housing costs, which places Sioux City in the top 10 overall for this metric as well.
Commute times in Sioux City average around 16.50 minutes, a top-20 score. Out of the city’s total establishments, 1.91% are focused on arts, entertainment and recreation, offering Sioux City residents plenty of options for activities.
7. St. Charles, MO
St. Charles, Missouri ranks first overall in the unemployment rate metric. The St. Louis suburb has an unemployment rate of just 1.70%. That’s the lowest rate in our study. Additionally, a large majority of residents here – 94.30% – have health insurance.
St. Charles also offers relative affordability. The typical home here is worth 2.91 times the median household income, and the average household spends about 19.22% of its income on housing costs.
8. Cranston, RI
Though it fell four spots from our ranking last year, Cranston, Rhode Island still has a lot to offer. The second-largest city in Rhode Island ranks in the top 25 for concentration of bars. Restaurants account for 8.32% of Cranston’s total establishments. Additionally, the city has an unemployment rate of just 3.80%. Only 3.60% of its residents are uninsured.
9. Warwick, RI
Warwick, Rhode Island is another city that makes its debut this year in our top 10 most livable small cities. In particular, Warwick has a substantial number of options when it comes to both entertainment and dining out. Of its total establishments, 1.38% are arts, entertainment and recreation establishments, and 8.01% are restaurants.
Out of the cities in the top 10, Warwick has the third-lowest percentage of residents below the poverty line. Roughly 93.30% of Warwick residents live above the poverty line. Homes are relatively affordable in Warwick as well, with the median home worth just 2.95 times the median household income.
10. Eau Claire, WI
This year is also Eau Claire, Wisconsin’s first year breaking into our top 10. Located in west-central Wisconsin, the city rates in the top 20 for three metrics: bars, healthcare establishments and average commute time. More specifically, it ranks third overall for bars, which comprise 1.88% of Eau Claire’s total establishments. Healthcare and social assistance establishments account for 14.10%. The typical commute here is about 16 minutes, which is the shortest commute out of any city in our top 10.
On the downside, Eau Claire has the highest percentage of residents of living below the poverty line (19%) of any city in our top 10.
Data and Methodology
In order to create our ranking of the most livable small cities in the U.S., we looked at data for 238 cities with a population of at least 65,000 but less than 100,000. Specifically, we looked at data for the following 11 metrics:
- Concentration of entertainment establishments. This is the number of arts, entertainment and recreation establishments as a percentage of all establishments in a city. Data comes from the U.S. Census Bureau’s 2016 County Business Patterns Survey.
- Concentration of bars. This is the number of bars as a percentage of all establishments in a city. Data comes from the U.S. Census Bureau’s 2016 County Business Patterns Survey.
- Concentration of restaurants. This is the number of restaurants as a percentage of all establishments in a city. Data comes from the U.S. Census Bureau’s 2016 County Business Patterns Survey.
- Concentration of healthcare establishments. This is the number of healthcare and social assistance establishments as a percentage of all establishments in a city. Data comes from the U.S. Census Bureau’s 2016 County Business Patterns Survey.
- Gini coefficient. This is a measure of income inequality. Data comes from the U.S. Census Bureau’s 2017 1-Year American Community Survey.
- Home affordability. This is the median home value divided by median household income. Data comes from the U.S. Census Bureau’s 2017 1-Year American Community Survey.
- Housing costs as a percentage of median household income. This is an affordability metric that shows how much the average household would spend on housing as a percentage of their income, if they bought the median home. Data comes from the U.S. Census Bureau’s 2017 1-Year American Community Survey.
- Percentage of residents below poverty line. Data comes from the U.S. Census Bureau’s 2017 1-Year American Community Survey.
- Unemployment rate. Data comes from the U.S. Census Bureau’s 2017 1-Year American Community Survey.
- Percentage of residents without health insurance. Data comes from the U.S. Census Bureau’s 2017 1-Year American Community Survey.
- Average commute time. This measures a worker’s average commute time in minutes. Data comes from the U.S. Census Bureau’s 2017 1-Year American Community Survey.
First, we ranked each city in each metric. Next we found each city’s average ranking. We used this average ranking to create our final scores. The city with the best average ranking received a score of 100. The city with the worst average ranking received a score of 0.
Tips for Buying a Home You Can Afford
- Start saving early. It’s important to start saving for a home as soon as you can. As a result of compound interest, starting early will add up to far more money over time, even if you only begin to save with relatively little. There are a few places to consider stashing your savings. A high-yield savings account is a great option. The best high-yield accounts have interest rates of 2% or more. That’s far above the national average of 0.10%.
- Don’t overspend. When you buy a home, it’s important to know how much house you can afford. Once you know your limit, don’t go over that amount. It’s tempting to spend a little extra to get the “perfect” home, but it may make things more challenging for you later on, when you’re struggling to pay your monthly bills.
- Get a second opinion. To help you choose the right home and to plan your finances after such a big expense, you may want to speak with a financial advisor. An advisor is an expert who can sit down with you to help look over your entire financial situation. Advisors have training in many areas of personal finance, so they can also help you with things like saving for retirement, tax planning, estate planning or even preparing your finances for growing your family. You can simplify the advisor search process with this free financial advisor matching tool. It will narrow your search down to up to three in your area who meet your needs.
Becca Stanek, CEPF® contributed additional reporting.
Questions about our study? Contact us at press@smartasset.com
Photo credit: ©iStock.com/DebraMillet